Random variates are random numbers that are generated according to a specific probability distribution. They are used in simulations to model real-world phenomena that follow certain statistical properties. For example, if you want to simulate the time between arrivals of customers at a store, you might use an exponential distribution to generate random variates that represent these inter-arrival times.
First our lib functions,
import math, random
import matplotlib.pyplot as plt
Inverse Transform
The inverse transform method is a technique for generating random variates from a given probability distribution. It relies on the cumulative distribution function (CDF) of the target distribution. The idea is to generate a uniform random number between 0 and 1, and then use the inverse of the CDF to transform this uniform random number into a random variate that follows the desired distribution.
Exponential Distribution
def inverse_transform_exponential(uniform_numbers, rate_lambda):
    exponential_variates = []
    for u in uniform_numbers:
        x = -math.log(1 - u) * rate_lambda  # Inverse CDF for exponential distribution
        exponential_variates.append(x)
    return exponential_variates
uniform_numbers = [random.random() for _ in range(1000)]
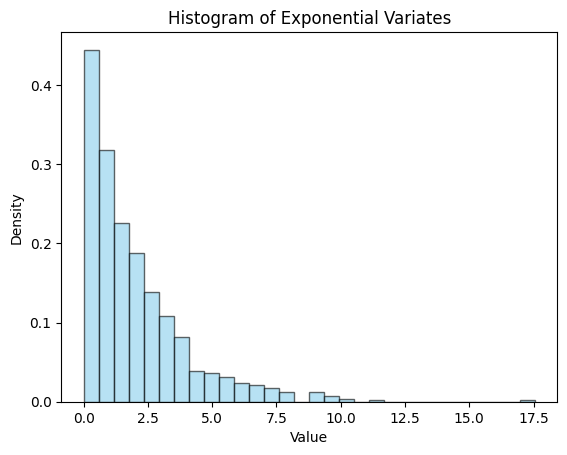
exponential_variates = inverse_transform_exponential(uniform_numbers, rate_lambda=2)
print(exponential_variates[:10]) # Print the first 10 exponential variates[0.06877342512257881, 1.7777060238162274, 0.9622152298750513, 0.3100037728548614, 3.104922465310846, 0.6780781342546255, 0.22243631125437877, 3.997122118375026, 7.183874236446966, 0.36290596398493863]
plt.hist(
    exponential_variates,
    bins=30,
    color="skyblue",
    edgecolor="black",
    density=True,
    alpha=0.6,
)
plt.title("Histogram of Exponential Variates")
plt.xlabel("Value")
plt.ylabel("Density")