In this notebook we will cover how to annotate images using OpenCV. We will learn how to peform the following annotations to images.
Draw lines
Draw circles
Draw rectangles
Add text
These are useful when you want to annotate your results for presentations or show a demo of your application. Annotations can also be useful during development and debugging.
# Import libraries
import os
import cv2
import matplotlib
import numpy as np
import matplotlib.pyplot as plt

from zipfile import ZipFile
from urllib.request import urlretrieve

matplotlib.rcParams['figure.figsize'] = (9.0, 9.0)
Download Assets
def download_and_unzip(url, save_path):
    print(f"Downloading and extracting assests....", end="")

    # Downloading zip file using urllib package.
    urlretrieve(url, save_path)

    try:
        # Extracting zip file using the zipfile package.
        with ZipFile(save_path) as z:
            # Extract ZIP file contents in the same directory.
            z.extractall(os.path.split(save_path)[0])

        print("Done")

    except Exception as e:
        print("\nInvalid file.", e)
URL = r"https://www.dropbox.com/s/48hboi1m4crv1tl/opencv_bootcamp_assets_NB3.zip?dl=1"
asset_zip_path = os.path.join(os.getcwd(), "opencv_bootcamp_assets_NB3.zip")
# Download if assest ZIP does not exists.
if not os.path.exists(asset_zip_path):
download_and_unzip(URL, asset_zip_path)# Read in an image
image = cv2.imread("Apollo_11_Launch.jpg", cv2.IMREAD_COLOR)
# Display the original image
plt.imshow(image[:, :, ::-1])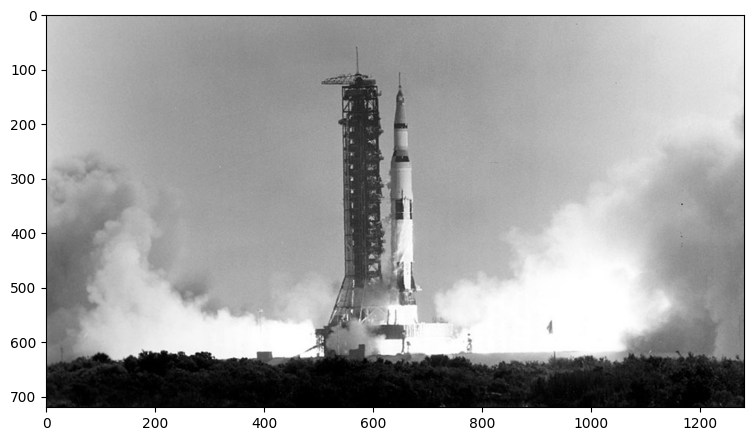
Drawing a Line
Let’s start off by drawing a line on an image. We will use cv2.line function for this.
Function Syntx
img = cv2.line(img, pt1, pt2, color[, thickness[, lineType[, shift]]])img: The output image that has been annotated.
The function has 4 required arguments:
img: Image on which we will draw a linept1: First point(x,y location) of the line segmentpt2: Second point of the line segmentcolor: Color of the line which will be drawn
Other optional arguments that are important for us to know include:
thickness: Integer specifying the line thickness. Default value is 1.lineType: Type of the line. Default value is 8 which stands for an 8-connected line. Usually, cv2.LINE_AA (antialiased or smooth line) is used for the lineType.
OpenCV Documentation
line: Documentation link
Let’s see an example of this.
imageLine = image.copy()

# The line starts from (200,100) and ends at (400,100)
# The color of the line is YELLOW (Recall that OpenCV uses BGR format)
# Thickness of line is 5px
# Linetype is cv2.LINE_AA

cv2.line(imageLine, (200, 100), (400, 100), (0, 255, 255), thickness=5, lineType=cv2.LINE_AA);

# Display the image
plt.imshow(imageLine[:,:,::-1])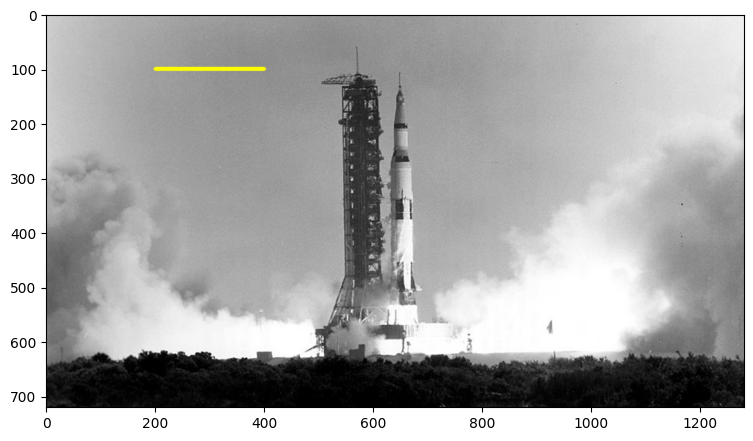
Drawing a Circle
Let’s start off by drawing a circle on an image. We will use cv2.circle function for this.
Functional syntx
img = cv2.circle(img, center, radius, color[, thickness[, lineType[, shift]]])img: The output image that has been annotated.
The function has 4 required arguments:
img: Image on which we will draw a linecenter: Center of the circleradius: Radius of the circlecolor: Color of the circle which will be drawn
Next, let’s check out the (optional) arguments which we are going to use quite extensively.
thickness: Thickness of the circle outline (if positive). If a negative value is supplied for this argument, it will result in a filled circle.lineType: Type of the circle boundary. This is exact same as lineType argument in cv2.line
OpenCV Documentation
circle: Documentation link
Let’s see an example of this.
# Draw a circle
imageCircle = image.copy()

cv2.circle(imageCircle, (900,500), 100, (0, 0, 255), thickness=5, lineType=cv2.LINE_AA);

# Display the image
plt.imshow(imageCircle[:,:,::-1])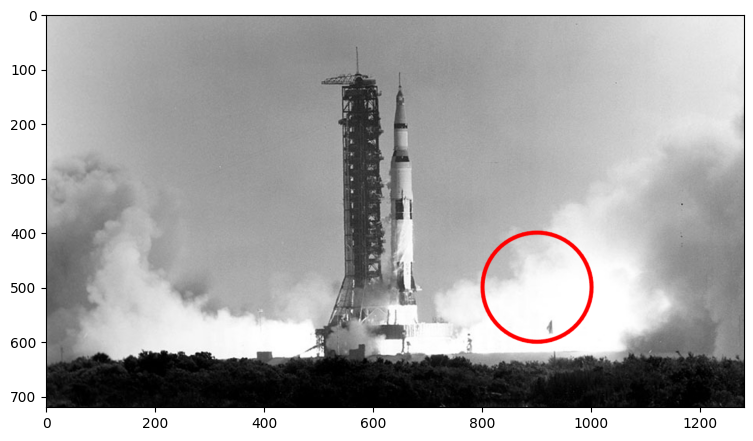
Drawing a Rectangle
We will use cv2.rectangle function to draw a rectangle on an image. The function syntax is as follows.
Functional syntx
img = cv2.rectangle(img, pt1, pt2, color[, thickness[, lineType[, shift]]])img: The output image that has been annotated.
The function has 4 required arguments:
img: Image on which the rectangle is to be drawn.pt1: Vertex of the rectangle. Usually we use the top-left vertex here.pt2: Vertex of the rectangle opposite to pt1. Usually we use the bottom-right vertex here.color: Rectangle color
Next, let’s check out the (optional) arguments which we are going to use quite extensively.
thickness: Thickness of the rectangle outline (if positive). If a negative value is supplied for this argument, it will result in a filled rectangle.lineType: Type of the rectangle boundary. This is exact same as lineType argument in cv2.line
OpenCV Documentation Links
rectangle: Documentation link
Let’s see an example of this.
# Draw a rectangle (thickness is a positive integer)
imageRectangle = image.copy()

cv2.rectangle(imageRectangle, (500, 100), (700, 600), (255, 0, 255), thickness=5, lineType=cv2.LINE_8)

# Display the image
plt.imshow(imageRectangle[:, :, ::-1])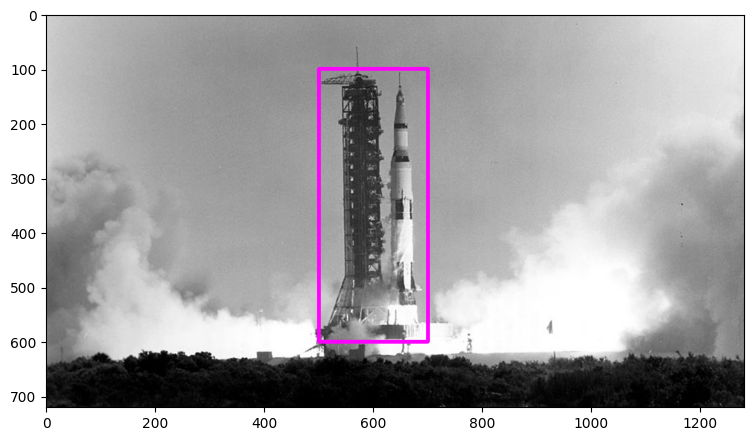
Adding Text
Finally, let’s see how we can write some text on an image using cv2.putText function.
Functional syntx
img = cv2.putText(img, text, org, fontFace, fontScale, color[, thickness[, lineType[, bottomLeftOrigin]]])img: The output image that has been annotated.
The function has 6 required arguments:
img: Image on which the text has to be written.text: Text string to be written.org: Bottom-left corner of the text string in the image.fontFace: Font typefontScale: Font scale factor that is multiplied by the font-specific base size.color: Font color
Other optional arguments that are important for us to know include:
thickness: Integer specifying the line thickness for the text. Default value is 1.lineType: Type of the line. Default value is 8 which stands for an 8-connected line. Usually, cv2.LINE_AA (antialiased or smooth line) is used for the lineType.
OpenCV Documentation
putText: Documentation link
Let’s see an example of this.
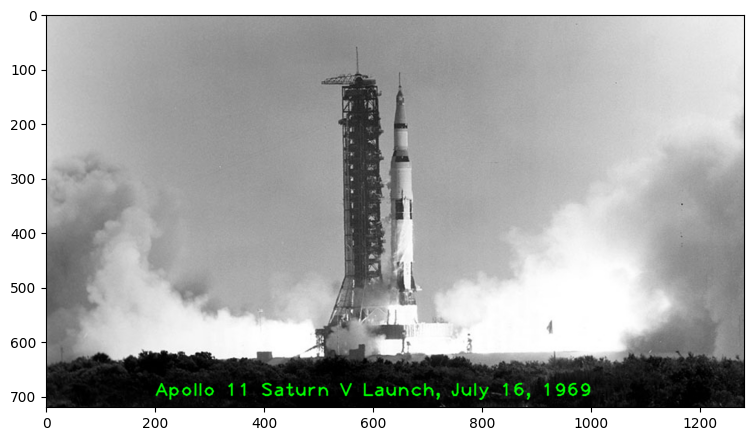
imageText = image.copy()
text = "Apollo 11 Saturn V Launch, July 16, 1969"
fontScale = 2.3
fontFace = cv2.FONT_HERSHEY_PLAIN
fontColor = (0, 255, 0)
fontThickness = 2

cv2.putText(imageText, text, (200, 700), fontFace, fontScale, fontColor, fontThickness, cv2.LINE_AA);

# Display the image
plt.imshow(imageText[:, :, ::-1])