Index Basics
import pandas as pd
btc = pd.read_csv("data/coin_Bitcoin.csv")btcLoading...
btc.set_index("Date")Loading...
btc # not persisted?Loading...
Inplace
It’ll actually replace original index with the custom one.
btc.set_index("Date", inplace=True)btcLoading...
btc.indexIndex(['2013-04-29 23:59:59', '2013-04-30 23:59:59', '2013-05-01 23:59:59',
'2013-05-02 23:59:59', '2013-05-03 23:59:59', '2013-05-04 23:59:59',
'2013-05-05 23:59:59', '2013-05-06 23:59:59', '2013-05-07 23:59:59',
'2013-05-08 23:59:59',
...
'2021-06-27 23:59:59', '2021-06-28 23:59:59', '2021-06-29 23:59:59',
'2021-06-30 23:59:59', '2021-07-01 23:59:59', '2021-07-02 23:59:59',
'2021-07-03 23:59:59', '2021-07-04 23:59:59', '2021-07-05 23:59:59',
'2021-07-06 23:59:59'],
dtype='object', name='Date', length=2991)btc.HighDate
2013-04-29 23:59:59 147.488007
2013-04-30 23:59:59 146.929993
2013-05-01 23:59:59 139.889999
2013-05-02 23:59:59 125.599998
2013-05-03 23:59:59 108.127998
...
2021-07-02 23:59:59 33939.588699
2021-07-03 23:59:59 34909.259899
2021-07-04 23:59:59 35937.567147
2021-07-05 23:59:59 35284.344430
2021-07-06 23:59:59 35038.536363
Name: High, Length: 2991, dtype: float64btc.High.plot()<Axes: xlabel='Date'>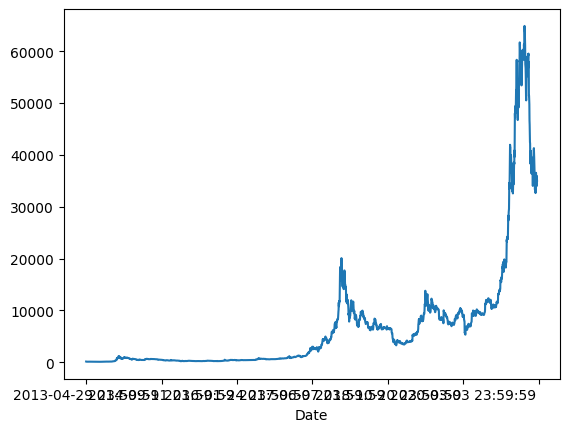
# Meanwhile on the default state it includes just range on the X-axis
btc = pd.read_csv("data/coin_Bitcoin.csv")
btc.High.plot()
<Axes: >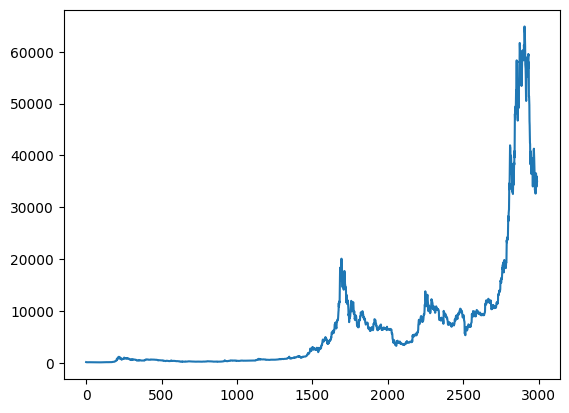
# We can also use row index to define index_col
df = pd.read_csv("data/world-happiness-report-2021.csv", index_col=0)
df["Ladder score"]Country name
Finland 7.842
Denmark 7.620
Switzerland 7.571
Iceland 7.554
Netherlands 7.464
...
Lesotho 3.512
Botswana 3.467
Rwanda 3.415
Zimbabwe 3.145
Afghanistan 2.523
Name: Ladder score, Length: 149, dtype: float64Sorting
countries = pd.read_csv("data/world-happiness-report-2021.csv")
countries.sort_values("Healthy life expectancy")
Loading...
countries.sort_values("Healthy life expectancy", ascending=False)Loading...
countriesLoading...
countries.sort_values("Healthy life expectancy", ascending=False, inplace=True)countries # now sorting is persisedLoading...
houses = pd.read_csv("data/kc_house_data.csv")
titanic = pd.read_csv("data/titanic.csv")
houses.sort_values(["bedrooms", "bathrooms"], ascending=False)Loading...
titanic.sort_values("name")
# ABC...YZabc...yz - this kind of sorting is used actually
Loading...
titanic.sort_values("name",key=lambda col: col.str.lower())Loading...
countriesLoading...
countries.sort_index()Loading...
countries.sort_index(ascending=False, inplace=True)countriesLoading...
titanic.sort_index(ascending=False)Loading...
titanic.pclass.value_counts().sort_values()pclass
2 277
1 323
3 709
Name: count, dtype: int64titanic.pclass.value_counts().plot(kind="bar")<Axes: xlabel='pclass'>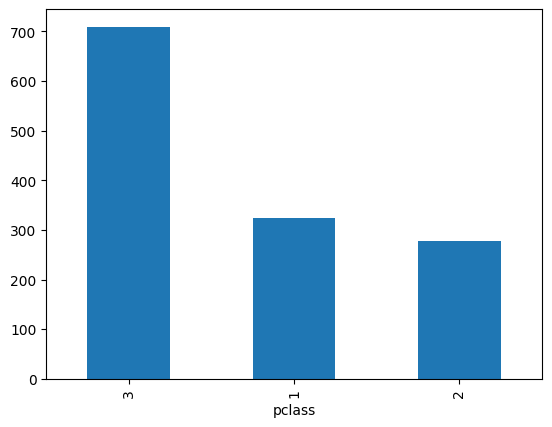
titanic.pclass.value_counts().sort_values().plot(kind="bar")<Axes: xlabel='pclass'>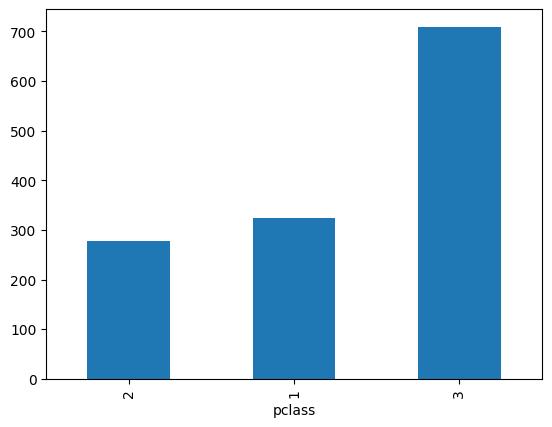
titanic.pclass.value_counts().sort_index().plot(kind="bar")<Axes: xlabel='pclass'>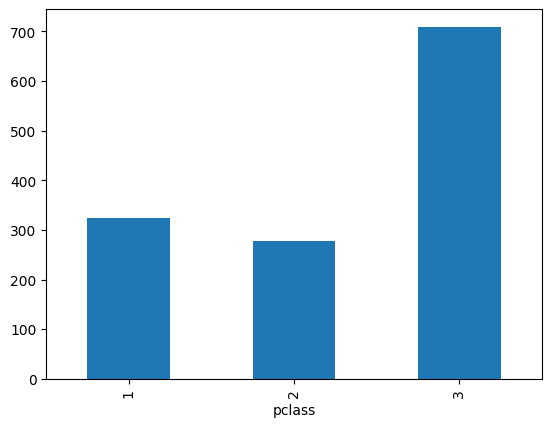
houses.bedrooms.value_counts().sort_values().plot(kind="bar")<Axes: xlabel='bedrooms'>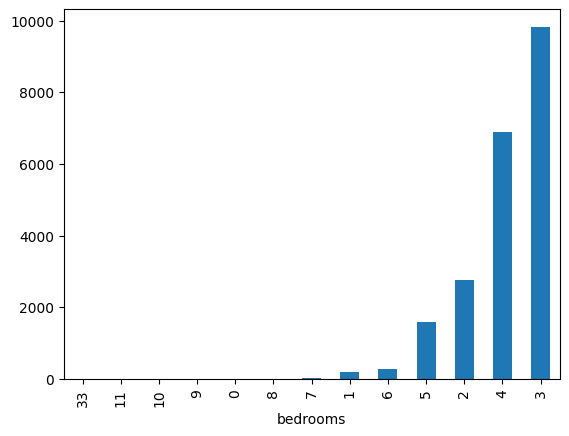
houses.bedrooms.value_counts().sort_index().plot(kind="bar")<Axes: xlabel='bedrooms'>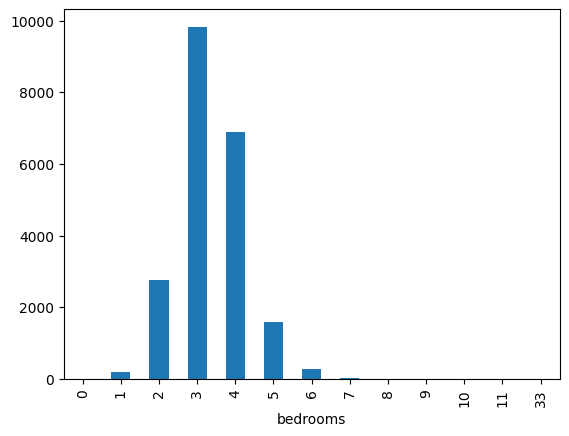
loc[] & iloc[]
countries.set_index("Country name", inplace=True)
countries["Ladder score"]
Country name
Afghanistan 2.523
Zimbabwe 3.145
Rwanda 3.415
Botswana 3.467
Lesotho 3.512
...
Netherlands 7.464
Iceland 7.554
Switzerland 7.571
Denmark 7.620
Finland 7.842
Name: Ladder score, Length: 149, dtype: float64countries.loc["Yemen"] # All the data from Yemen, for eg. check ladder score with aboveRegional indicator Middle East and North Africa
Ladder score 3.658
Standard error of ladder score 0.07
upperwhisker 3.794
lowerwhisker 3.521
Logged GDP per capita 7.578
Social support 0.832
Healthy life expectancy 57.122
Freedom to make life choices 0.602
Generosity -0.147
Perceptions of corruption 0.8
Ladder score in Dystopia 2.43
Explained by: Log GDP per capita 0.329
Explained by: Social support 0.831
Explained by: Healthy life expectancy 0.272
Explained by: Freedom to make life choices 0.268
Explained by: Generosity 0.092
Explained by: Perceptions of corruption 0.089
Dystopia + residual 1.776
Name: Yemen, dtype: objectcountries.loc[["Yemen"]] # same but returns a dataframe, not seriesLoading...
countries.loc[["Canada"]]Loading...
countries.loc[["Canada", "Mexico", "United States"]]Loading...
titanic.loc[[7,9,876]]Loading...
titanic.loc[5:10]Loading...
titanic.loc[5:10:2]Loading...
countries.sort_index(inplace=True)countriesLoading...
countries.loc["Denmark":"France"]Loading...
# Just like loc but here we have to pass index
countries.iloc[0]
Regional indicator South Asia
Ladder score 2.523
Standard error of ladder score 0.038
upperwhisker 2.596
lowerwhisker 2.449
Logged GDP per capita 7.695
Social support 0.463
Healthy life expectancy 52.493
Freedom to make life choices 0.382
Generosity -0.102
Perceptions of corruption 0.924
Ladder score in Dystopia 2.43
Explained by: Log GDP per capita 0.37
Explained by: Social support 0.0
Explained by: Healthy life expectancy 0.126
Explained by: Freedom to make life choices 0.0
Explained by: Generosity 0.122
Explained by: Perceptions of corruption 0.01
Dystopia + residual 1.895
Name: Afghanistan, dtype: objectcountries.iloc[[0]] Loading...
countries.iloc[[10,20,30,100]]Loading...
countries.iloc[50:60]Loading...
houses.sort_index(ascending=False, inplace=True)housesLoading...
houses.iloc[0:5]Loading...
houses.loc[21612:21611]Loading...
houses.loc[21612:21611, ['price', 'bedrooms']]Loading...
titanic.loc[50:60:2, ['name', 'sex', 'age']]Loading...
countries.loc["Canada": "Denmark", ['Ladder score']]Loading...
countries.loc["Canada": "Denmark"]['Ladder score']Country name
Canada 7.103
Chad 4.355
Chile 6.172
China 5.339
Colombia 6.012
Comoros 4.289
Congo (Brazzaville) 5.342
Costa Rica 7.069
Croatia 5.882
Cyprus 6.223
Czech Republic 6.965
Denmark 7.620
Name: Ladder score, dtype: float64houses["bedrooms"].value_counts().loc[33]np.int64(1)titanic["age"].value_counts().loc["18"]np.int64(39)titanic["age"].value_counts().iloc[0:5]age
? 263
24 47
22 43
21 41
30 40
Name: count, dtype: int64