pd.to_datetime( )
import pandas as pd
"2019-12-31"
"2019-31-12"
"12-31-2019"
"31-12-2019"
"31/12/2019"
"31.12.2019"
"12-31-19"
"December 31st 2019"
"Dec. 31st 19"
"2019-31-12 11:59pm"
"2019-31-12 23:59"
"2019-31-12 23:59:45"
'2019-31-12 23:59:45'pd.to_datetime("2019-12-31")Timestamp('2019-12-31 00:00:00')pd.to_datetime("2019/12/31")Timestamp('2019-12-31 00:00:00')pd.to_datetime("December 31st 2019")Timestamp('2019-12-31 00:00:00')pd.to_datetime("December 31st 2019 4pm")Timestamp('2019-12-31 16:00:00')pd.to_datetime("December 31st 2019 4:50am")Timestamp('2019-12-31 04:50:00')pd.to_datetime("Dec. 25 1990 12pm")Timestamp('1990-12-25 12:00:00')pd.to_datetime("3:55:45 Apr. 2nd 90")Timestamp('1990-04-02 03:55:45')dates = ["3:55:45 Apr. 2nd 90", "3:55:45 Apr. 22nd 91", "7:55:45 Jan. 2nd 90"]
pd.to_datetime(dates)/tmp/ipykernel_29445/2244665249.py:2: UserWarning: Could not infer format, so each element will be parsed individually, falling back to `dateutil`. To ensure parsing is consistent and as-expected, please specify a format.
pd.to_datetime(dates)
DatetimeIndex(['1990-04-02 03:55:45', '1991-04-22 03:55:45',
               '1990-01-02 07:55:45'],
dtype='datetime64[ns]', freq=None)pd.to_datetime("10/11/12")Timestamp('2012-10-11 00:00:00')pd.to_datetime("10/11/12", dayfirst=True)Timestamp('2012-11-10 00:00:00')pd.to_datetime("10/11/12", yearfirst=True)Timestamp('2010-11-12 00:00:00')pd.to_datetime("10/11/12", yearfirst=True, dayfirst=True)Timestamp('2010-12-11 00:00:00')pd.to_datetime("10/11/12", format="%y/%m/%d")Timestamp('2010-11-12 00:00:00')meetings = ["Dec 11 2019 Meeting","Jan 6 2020 Meeting", "Mar 19 2020 Meeting", "Apr 15 2020 Meeting"]pd.to_datetime(meetings, format="%b %d %Y Meeting")DatetimeIndex(['2019-12-11', '2020-01-06', '2020-03-19', '2020-04-15'], dtype='datetime64[ns]', freq=None)Dates & DataFrames
ufos = pd.read_csv("data/nuforc_reports.csv")ufos.info()<class 'pandas.core.frame.DataFrame'>
RangeIndex: 88125 entries, 0 to 88124
Data columns (total 12 columns):
# Column Non-Null Count Dtype
--- ------ -------------- -----
0 summary 88095 non-null object
1 city 87888 non-null object
2 state 82890 non-null object
3 date_time 86938 non-null object
4 shape 85627 non-null object
5 duration 84951 non-null object
6 stats 88088 non-null object
7 report_link 88125 non-null object
8 text 88070 non-null object
9 posted 86938 non-null object
10 city_latitude 72013 non-null float64
11 city_longitude 72013 non-null float64
dtypes: float64(2), object(10)
memory usage: 8.1+ MB
pd.to_datetime(ufos["date_time"])0 2019-12-12 18:43:00
1 2019-03-22 18:30:00
2 NaT
3 2019-04-17 02:00:00
4 2009-03-15 18:00:00
...
88120 2019-10-02 20:00:00
88121 2019-10-02 20:00:00
88122 2019-10-02 20:03:00
88123 2019-10-02 22:00:00
88124 2019-10-02 22:00:00
Name: date_time, Length: 88125, dtype: datetime64[ns]ufos.info()<class 'pandas.core.frame.DataFrame'>
RangeIndex: 88125 entries, 0 to 88124
Data columns (total 12 columns):
# Column Non-Null Count Dtype
--- ------ -------------- -----
0 summary 88095 non-null object
1 city 87888 non-null object
2 state 82890 non-null object
3 date_time 86938 non-null object
4 shape 85627 non-null object
5 duration 84951 non-null object
6 stats 88088 non-null object
7 report_link 88125 non-null object
8 text 88070 non-null object
9 posted 86938 non-null object
10 city_latitude 72013 non-null float64
11 city_longitude 72013 non-null float64
dtypes: float64(2), object(10)
memory usage: 8.1+ MB
ufos["date"] = pd.to_datetime(ufos["date_time"])ufos.info()<class 'pandas.core.frame.DataFrame'>
RangeIndex: 88125 entries, 0 to 88124
Data columns (total 13 columns):
# Column Non-Null Count Dtype
--- ------ -------------- -----
0 summary 88095 non-null object
1 city 87888 non-null object
2 state 82890 non-null object
3 date_time 86938 non-null object
4 shape 85627 non-null object
5 duration 84951 non-null object
6 stats 88088 non-null object
7 report_link 88125 non-null object
8 text 88070 non-null object
9 posted 86938 non-null object
10 city_latitude 72013 non-null float64
11 city_longitude 72013 non-null float64
12 date 86938 non-null datetime64[ns]
dtypes: datetime64[ns](1), float64(2), object(10)
memory usage: 8.7+ MB
ufos.tail()Loading...
ufos["date_time"] = pd.to_datetime(ufos["date_time"])ufos.info()<class 'pandas.core.frame.DataFrame'>
RangeIndex: 88125 entries, 0 to 88124
Data columns (total 13 columns):
# Column Non-Null Count Dtype
--- ------ -------------- -----
0 summary 88095 non-null object
1 city 87888 non-null object
2 state 82890 non-null object
3 date_time 86938 non-null datetime64[ns]
4 shape 85627 non-null object
5 duration 84951 non-null object
6 stats 88088 non-null object
7 report_link 88125 non-null object
8 text 88070 non-null object
9 posted 86938 non-null object
10 city_latitude 72013 non-null float64
11 city_longitude 72013 non-null float64
12 date 86938 non-null datetime64[ns]
dtypes: datetime64[ns](2), float64(2), object(9)
memory usage: 8.7+ MB
ufos = pd.read_csv("data/nuforc_reports.csv", parse_dates=["date_time"])ufos.info()<class 'pandas.core.frame.DataFrame'>
RangeIndex: 88125 entries, 0 to 88124
Data columns (total 12 columns):
# Column Non-Null Count Dtype
--- ------ -------------- -----
0 summary 88095 non-null object
1 city 87888 non-null object
2 state 82890 non-null object
3 date_time 86938 non-null datetime64[ns]
4 shape 85627 non-null object
5 duration 84951 non-null object
6 stats 88088 non-null object
7 report_link 88125 non-null object
8 text 88070 non-null object
9 posted 86938 non-null object
10 city_latitude 72013 non-null float64
11 city_longitude 72013 non-null float64
dtypes: datetime64[ns](1), float64(2), object(9)
memory usage: 8.1+ MB
.dt Date Properties
ufos["date_time"].dt.year.value_counts()date_time
2014.0 8704
2012.0 8124
2013.0 7823
2015.0 6915
2019.0 5767
2016.0 5664
2011.0 5630
2008.0 5307
2017.0 5057
2009.0 4996
2010.0 4786
2007.0 4736
2006.0 3720
2018.0 3273
2005.0 566
2004.0 340
1997.0 300
2001.0 263
2000.0 243
2003.0 238
1998.0 229
1999.0 220
2002.0 220
1995.0 219
1996.0 200
1994.0 197
1978.0 195
1975.0 180
1977.0 169
1976.0 164
1993.0 148
1979.0 148
1974.0 148
1988.0 147
1973.0 138
1985.0 133
1990.0 132
1980.0 131
1989.0 131
1992.0 130
1987.0 124
1991.0 119
1986.0 111
1983.0 109
1981.0 106
1970.0 100
1969.0 97
1982.0 97
1972.0 92
1984.0 84
1971.0 68
Name: count, dtype: int64ufos["date_time"].dt.year.value_counts().head(10).plot(kind="bar")<Axes: xlabel='date_time'>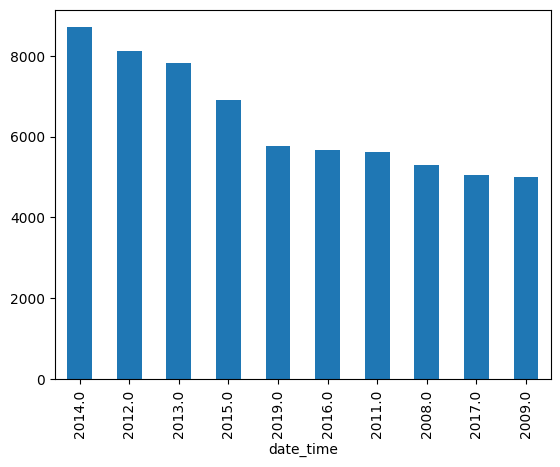
ufos["date_time"].dt.month0 12.0
1 3.0
2 NaN
3 4.0
4 3.0
...
88120 10.0
88121 10.0
88122 10.0
88123 10.0
88124 10.0
Name: date_time, Length: 88125, dtype: float64ufos["date_time"].dt.month.value_counts()date_time
7.0 10682
8.0 8997
9.0 8498
10.0 8371
6.0 8357
11.0 7596
12.0 6525
5.0 6063
1.0 5979
4.0 5817
3.0 5494
2.0 4559
Name: count, dtype: int64ufos["date_time"].dt.day0 12.0
1 22.0
2 NaN
3 17.0
4 15.0
...
88120 2.0
88121 2.0
88122 2.0
88123 2.0
88124 2.0
Name: date_time, Length: 88125, dtype: float64ufos["date_time"].dt.hour.value_counts()date_time
21.0 12851
22.0 11660
20.0 9565
23.0 8194
19.0 6460
0.0 5577
18.0 4462
1.0 3285
17.0 2660
2.0 2216
3.0 2088
5.0 1874
4.0 1641
16.0 1612
6.0 1588
12.0 1408
15.0 1380
10.0 1334
13.0 1308
11.0 1301
14.0 1280
9.0 1126
7.0 1067
8.0 1001
Name: count, dtype: int64ufos["date_time"].dt.hour.value_counts().plot(kind="bar")<Axes: xlabel='date_time'>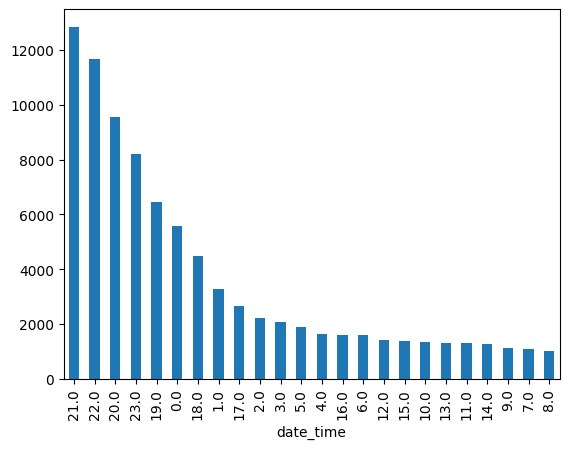
ufos["date_time"].dt.dayofweek.value_counts()date_time
5.0 16305
4.0 12864
6.0 12652
3.0 11729
2.0 11646
1.0 10987
0.0 10755
Name: count, dtype: int64ufos["date_time"]0 2019-12-12 18:43:00
1 2019-03-22 18:30:00
2 NaT
3 2019-04-17 02:00:00
4 2009-03-15 18:00:00
...
88120 2019-10-02 20:00:00
88121 2019-10-02 20:00:00
88122 2019-10-02 20:03:00
88123 2019-10-02 22:00:00
88124 2019-10-02 22:00:00
Name: date_time, Length: 88125, dtype: datetime64[ns]ufos[ufos["date_time"] < "1980"]Loading...
ufos[ufos["date_time"] > "2019-12-23"]Loading...
ufos[ufos["date_time"].dt.hour == 2.0].head()Loading...
ufos[ufos["date_time"].between("1988", "1989")].sort_values("date_time")Loading...
ufos[ufos["date_time"] > "2019-12-22"]Loading...
ufos["date_time"].value_counts()date_time
2015-11-07 18:00:00 104
2014-07-04 22:00:00 46
2010-07-04 22:00:00 37
2012-07-04 22:00:00 34
2015-07-04 22:00:00 27
...
2019-10-02 01:00:00 1
2019-10-01 22:45:00 1
2019-10-01 21:30:00 1
2019-10-01 21:20:00 1
2019-10-01 20:42:00 1
Name: count, Length: 73122, dtype: int64ufos["date_time"].dt.date.value_counts()date_time
2015-11-07 290
2014-07-04 270
2010-07-04 210
2012-07-04 200
2013-07-04 185
...
1974-10-05 1
1995-12-27 1
1982-04-30 1
1996-12-28 1
1984-05-14 1
Name: count, Length: 8351, dtype: int64recent_sightings = ufos[ufos["date_time"].dt.year >= 2018]
recent_sightings["date_time"].dt.date.value_counts()date_time
2019-11-11 77
2019-05-25 69
2019-05-26 67
2019-05-24 60
2019-07-04 57
..
2018-01-27 1
2018-02-04 1
2019-05-09 1
2019-12-29 1
2018-01-31 1
Name: count, Length: 719, dtype: int64ufos[ufos["date_time"].between("2019-05-24", "2019-05-26")]Loading...
ufos.info()<class 'pandas.core.frame.DataFrame'>
RangeIndex: 88125 entries, 0 to 88124
Data columns (total 12 columns):
# Column Non-Null Count Dtype
--- ------ -------------- -----
0 summary 88095 non-null object
1 city 87888 non-null object
2 state 82890 non-null object
3 date_time 86938 non-null datetime64[ns]
4 shape 85627 non-null object
5 duration 84951 non-null object
6 stats 88088 non-null object
7 report_link 88125 non-null object
8 text 88070 non-null object
9 posted 86938 non-null object
10 city_latitude 72013 non-null float64
11 city_longitude 72013 non-null float64
dtypes: datetime64[ns](1), float64(2), object(9)
memory usage: 8.1+ MB
ufos["posted"] = pd.to_datetime(ufos["posted"])ufos.info()<class 'pandas.core.frame.DataFrame'>
RangeIndex: 88125 entries, 0 to 88124
Data columns (total 12 columns):
# Column Non-Null Count Dtype
--- ------ -------------- -----
0 summary 88095 non-null object
1 city 87888 non-null object
2 state 82890 non-null object
3 date_time 86938 non-null datetime64[ns]
4 shape 85627 non-null object
5 duration 84951 non-null object
6 stats 88088 non-null object
7 report_link 88125 non-null object
8 text 88070 non-null object
9 posted 86938 non-null datetime64[ns]
10 city_latitude 72013 non-null float64
11 city_longitude 72013 non-null float64
dtypes: datetime64[ns](2), float64(2), object(8)
memory usage: 8.1+ MB
ufos["time_before_reported"] = ufos["posted"] - ufos["date_time"]ufosLoading...
longest_wait = ufos.sort_values("time_before_reported", ascending=False).head(10)longest_wait["time_before_reported"].dt.days86762 18463
87145 18353
721 18314
1576 18287
1580 18240
84984 18099
83965 17963
722 17951
723 17904
1301 17873
Name: time_before_reported, dtype: int64ufos["days_before_reporting"] = ufos["time_before_reported"].dt.daysufos.head()Loading...
charts = pd.read_csv("data/billboard_charts.csv", parse_dates=["date"])charts.info()<class 'pandas.core.frame.DataFrame'>
RangeIndex: 330087 entries, 0 to 330086
Data columns (total 7 columns):
# Column Non-Null Count Dtype
--- ------ -------------- -----
0 date 330087 non-null datetime64[ns]
1 rank 330087 non-null int64
2 song 330087 non-null object
3 artist 330087 non-null object
4 last-week 297775 non-null float64
5 peak-rank 330087 non-null int64
6 weeks-on-board 330087 non-null int64
dtypes: datetime64[ns](1), float64(1), int64(3), object(2)
memory usage: 17.6+ MB
charts["artist"].value_counts().head(10).plot(kind="bar")<Axes: xlabel='artist'>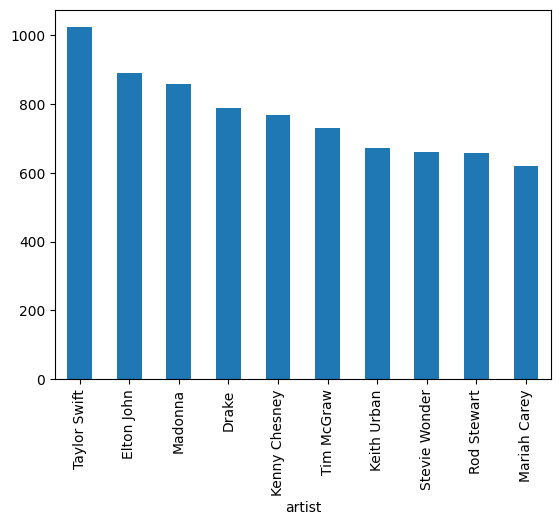
number_1s = charts["rank"] == 1
charts[number_1s]["artist"].value_counts().head(10).plot(kind="bar")
<Axes: xlabel='artist'>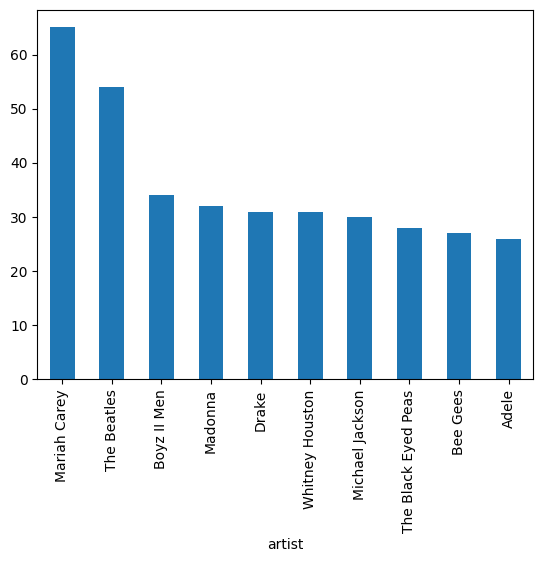
charts[number_1s]["song"].value_counts()song
Old Town Road 19
Despacito 16
One Sweet Day 16
Rockstar 15
I'll Make Love To You 14
..
Good 4 U 1
Montero (Call Me By Your Name) 1
Peaches 1
Up 1
What's Next 1
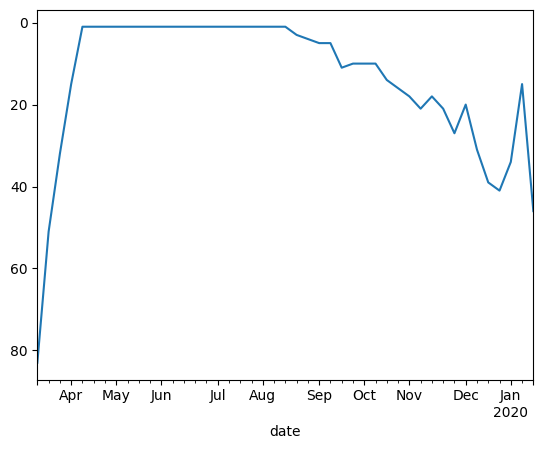
Name: count, Length: 1104, dtype: int64charts[charts["song"] == "Old Town Road"]Loading...
charts[charts["song"] == "Old Town Road"].set_index("date")["rank"].plot()<Axes: xlabel='date'>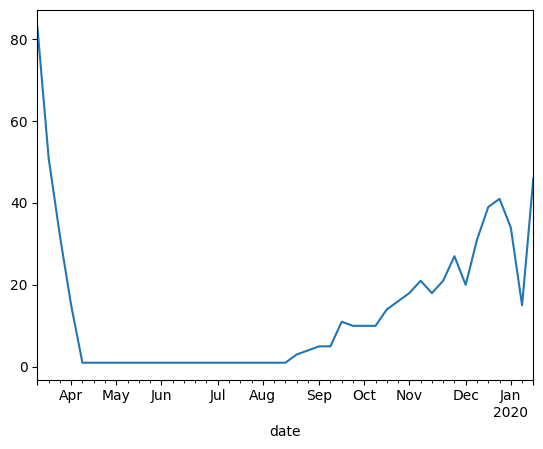
p = charts[charts["song"] == "Old Town Road"].set_index("date")["rank"].plot()
p.invert_yaxis()