import pandas as pd
import matplotlib.pyplot as plt
titanic = pd.read_csv("data/titanic.csv")
titanic["age"] = pd.to_numeric(titanic["age"], errors="coerce")houses = pd.read_csv("data/kc_house_data.csv")ufos = pd.read_csv("data/nuforc_reports.csv", parse_dates=['date_time', "posted"])titanic.sex.value_counts()sex
male 843
female 466
Name: count, dtype: int64titanic.sex.value_counts().plot(kind="bar")<Axes: xlabel='sex'>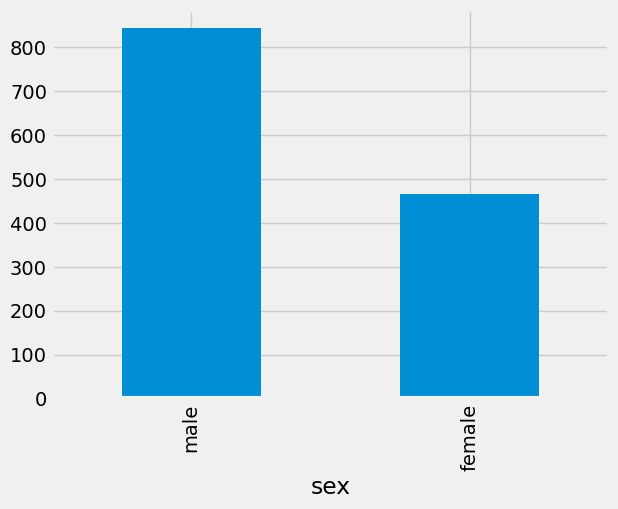
houses[["sqft_living", "sqft_lot"]].sort_values("sqft_living", ascending=False).head(10)Loading...
houses[["sqft_living", "sqft_lot"]].sort_values("sqft_living", ascending=False).head(10).plot(kind="bar")<Axes: >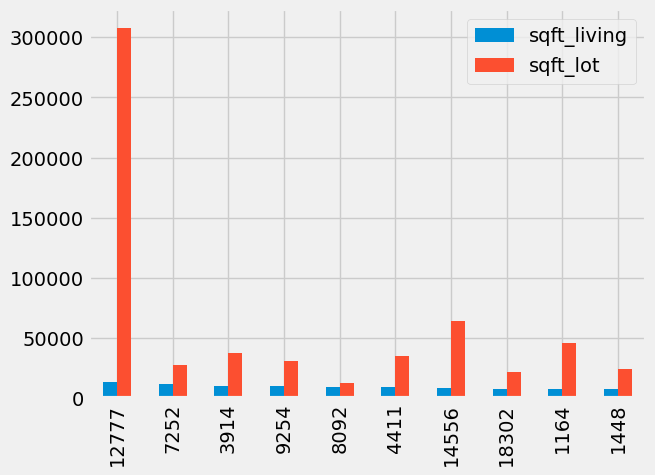
plt.style.available['Solarize_Light2',
'_classic_test_patch',
'_mpl-gallery',
'_mpl-gallery-nogrid',
'bmh',
'classic',
'dark_background',
'fast',
'fivethirtyeight',
'ggplot',
'grayscale',
'petroff10',
'seaborn-v0_8',
'seaborn-v0_8-bright',
'seaborn-v0_8-colorblind',
'seaborn-v0_8-dark',
'seaborn-v0_8-dark-palette',
'seaborn-v0_8-darkgrid',
'seaborn-v0_8-deep',
'seaborn-v0_8-muted',
'seaborn-v0_8-notebook',
'seaborn-v0_8-paper',
'seaborn-v0_8-pastel',
'seaborn-v0_8-poster',
'seaborn-v0_8-talk',
'seaborn-v0_8-ticks',
'seaborn-v0_8-white',
'seaborn-v0_8-whitegrid',
'tableau-colorblind10']plt.style.use("fivethirtyeight")titanic.sex.value_counts().plot(kind="bar")<Axes: xlabel='sex'>titanic.sex.value_counts().plot(kind="bar", title="Sex Breakdown On Titanic")<Axes: title={'center': 'Sex Breakdown On Titanic'}, xlabel='sex'>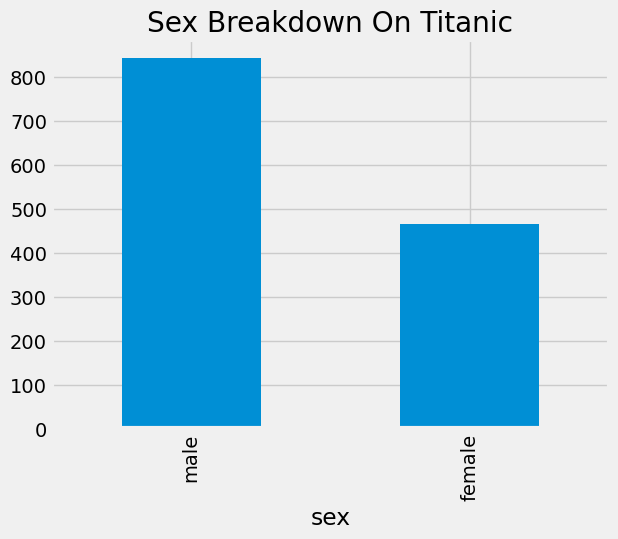
titanic.sex.value_counts().plot(kind="bar")
plt.title("My Title", loc="right")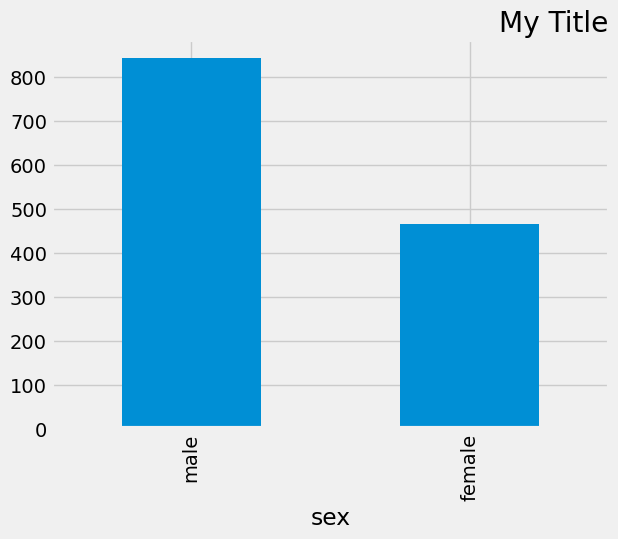
ufos["month"] = ufos["date_time"].dt.month
ufos["year"] = ufos["date_time"].dt.yearsightings = ufos.month.value_counts().sort_index()
sightings.plot(
kind="bar",
title="UFO Sightings By Month",
xlabel="Month",
ylabel="Num Sightings",
fontsize="10")<Axes: title={'center': 'UFO Sightings By Month'}, xlabel='Month', ylabel='Num Sightings'>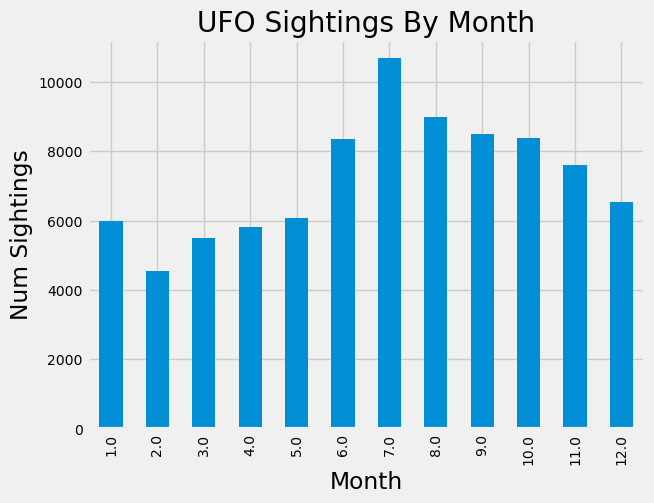
sightings = ufos.month.value_counts().sort_index()
sightings.plot(
kind="bar",
title="UFO Sightings By Month",
fontsize="10")
plt.xlabel("Month", fontsize=24, color="olive")
plt.ylabel("Num Sightings", fontsize=24)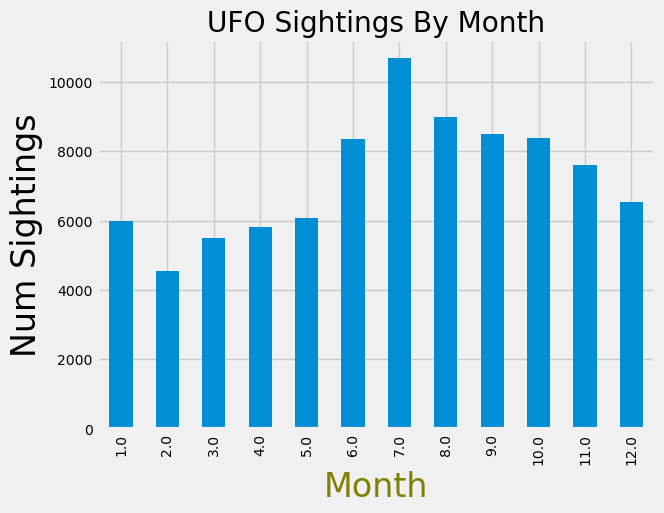
sightings = ufos.month.value_counts().sort_index()
sightings.plot(
kind="bar",
title="UFO Sightings By Month",
fontsize="10")
plt.xlabel("Month", fontsize=24, color="olive")
plt.ylabel("Num Sightings", fontsize=24)sightingsmonth
1.0 5979
2.0 4559
3.0 5494
4.0 5817
5.0 6063
6.0 8357
7.0 10682
8.0 8997
9.0 8498
10.0 8371
11.0 7596
12.0 6525
Name: count, dtype: int64months_dict = {1: "Jan", 2: "Feb", 3: "Mar", 4: "Apr", 5: "May", 6: "Jun", 7:"Jul", 8: "Aug", 9:"Sep", 10: "Oct", 11: "Nov", 12: "Dec"}
sightings.rename(months_dict)month
Jan 5979
Feb 4559
Mar 5494
Apr 5817
May 6063
Jun 8357
Jul 10682
Aug 8997
Sep 8498
Oct 8371
Nov 7596
Dec 6525
Name: count, dtype: int64sightings.rename(months_dict).plot(
kind="bar",
title="UFO Sightings By Month",
fontsize="20")
plt.xlabel("Month", fontsize=24, color="olive")
plt.ylabel("Num Sightings", fontsize=24)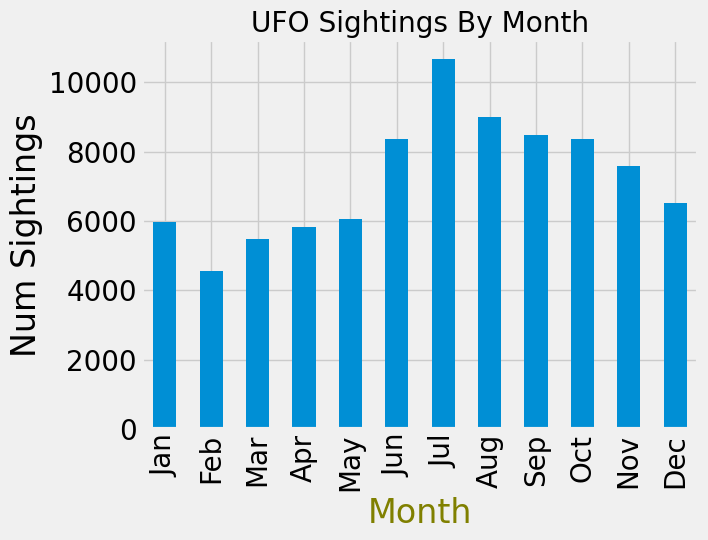
salaries = pd.read_csv("data/Salaries.csv", low_memory=False)salaries["BasePay"] = pd.to_numeric(salaries["BasePay"], errors="coerce").fillna(0)
salaries["OvertimePay"] = pd.to_numeric(salaries["OvertimePay"], errors="coerce").fillna(0)
salaries["OtherPay"] = pd.to_numeric(salaries["OtherPay"], errors="coerce").fillna(0)df = salaries[["EmployeeName", "BasePay", "OvertimePay", "OtherPay"]]df.set_index("EmployeeName", inplace=True)df.head(10).plot(kind="bar")<Axes: xlabel='EmployeeName'>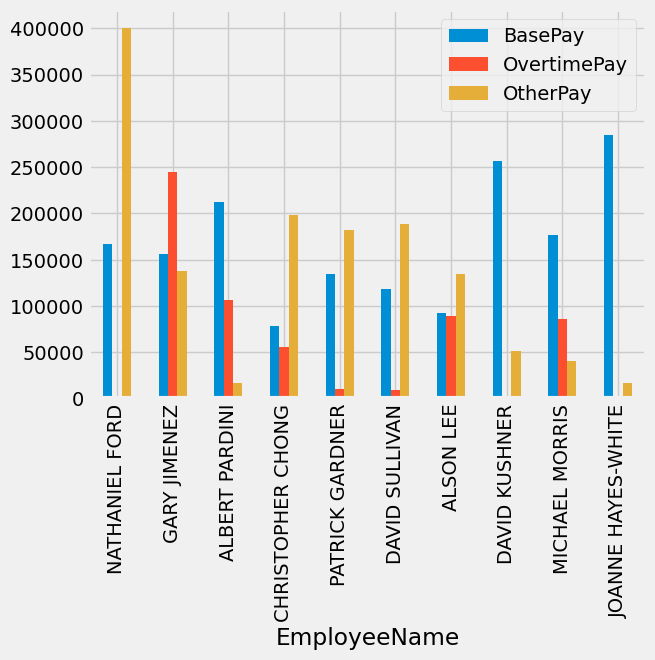
df.head(10).plot(kind="bar", stacked=True)<Axes: xlabel='EmployeeName'>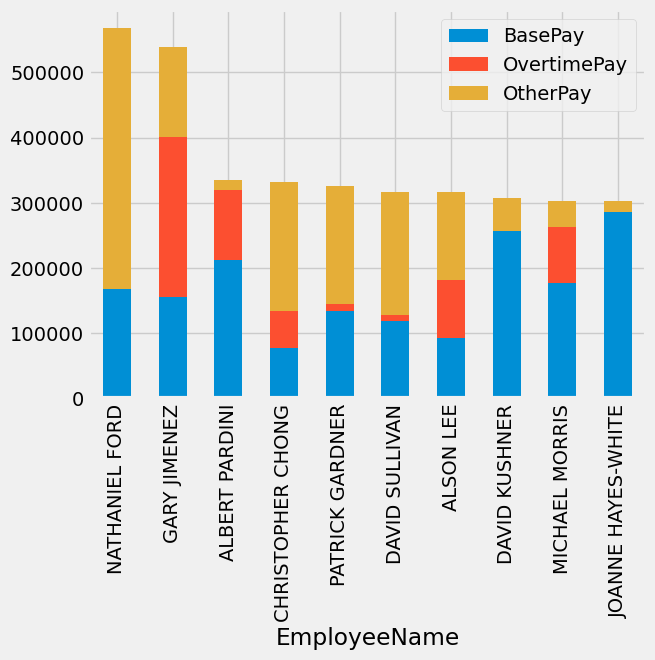
df["BasePay"].sort_values(ascending=False).head().plot(kind="bar")<Axes: xlabel='EmployeeName'>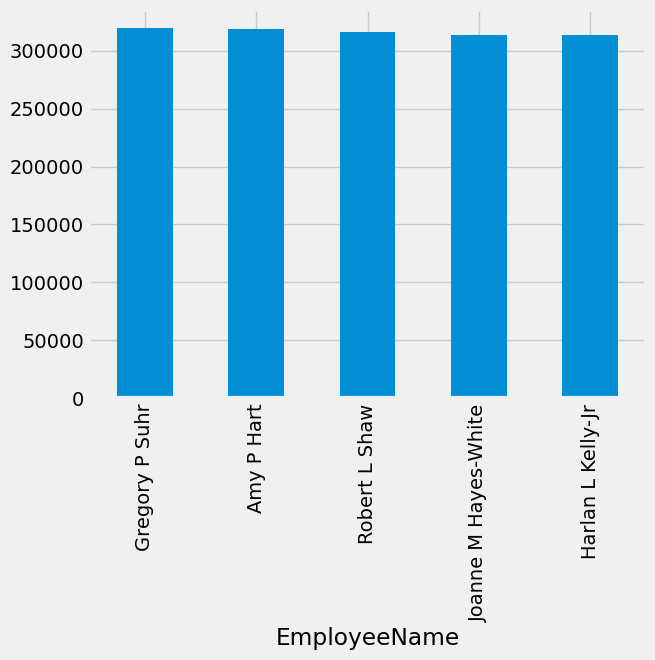
df["BasePay"].sort_values(ascending=False).head().plot.bar(color="red", title="Highest Paid SF Employees")<Axes: title={'center': 'Highest Paid SF Employees'}, xlabel='EmployeeName'>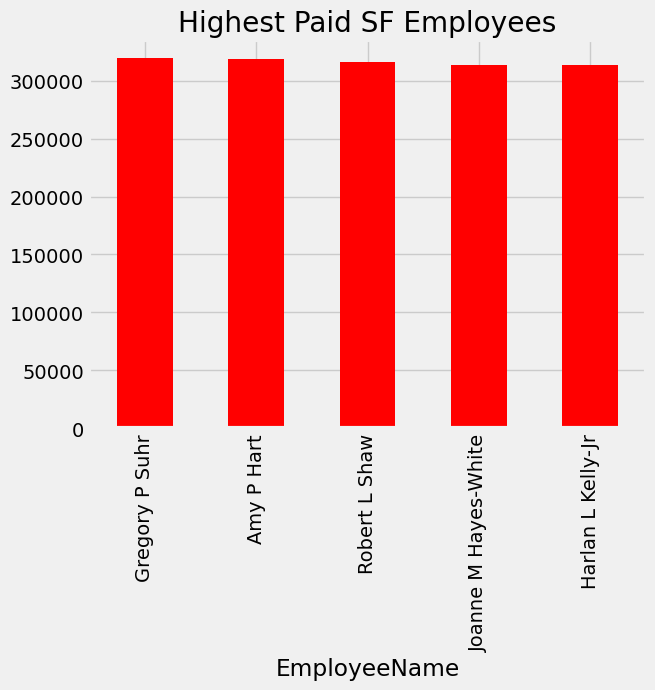
df["BasePay"].sort_values(ascending=False).head().plot.barh(color="red", title="Highest Paid SF Employees")<Axes: title={'center': 'Highest Paid SF Employees'}, ylabel='EmployeeName'>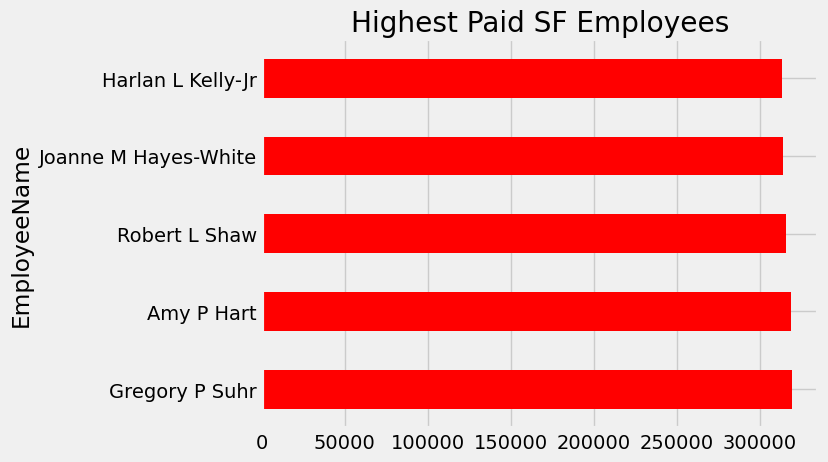
df.sort_values("OvertimePay", ascending=False).head().plot(kind="barh", stacked=True)<Axes: ylabel='EmployeeName'>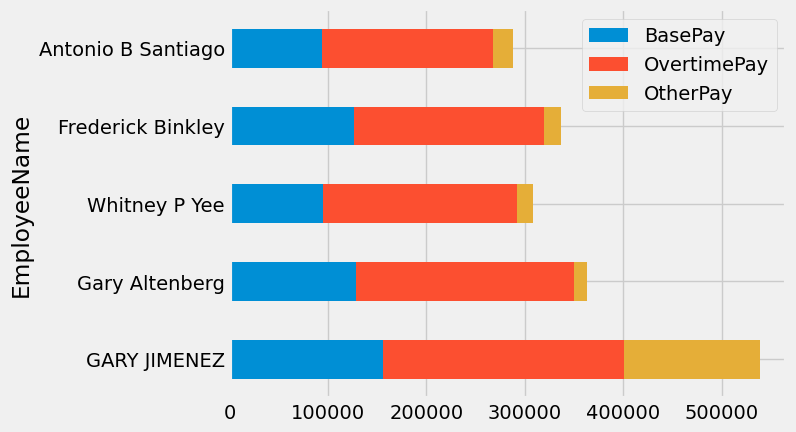
df.sort_values("OvertimePay", ascending=False).head().plot.barh(stacked=True)
plt.xlabel("Dollars")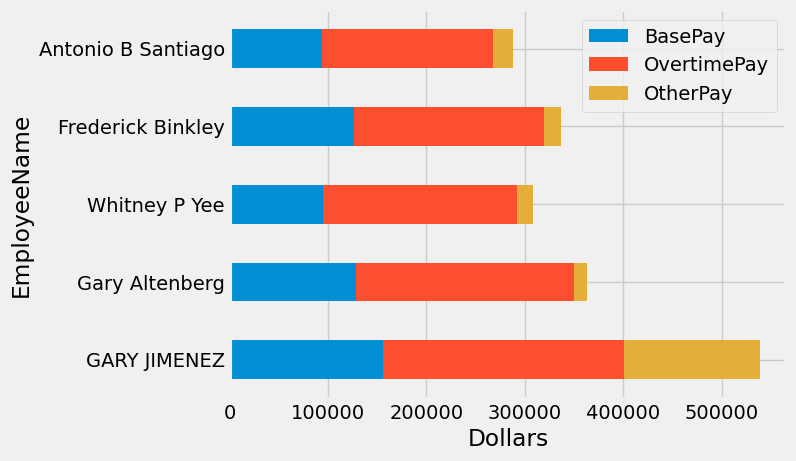
df["BasePay"].plot(kind="hist", bins=200, color="purple")<Axes: ylabel='Frequency'>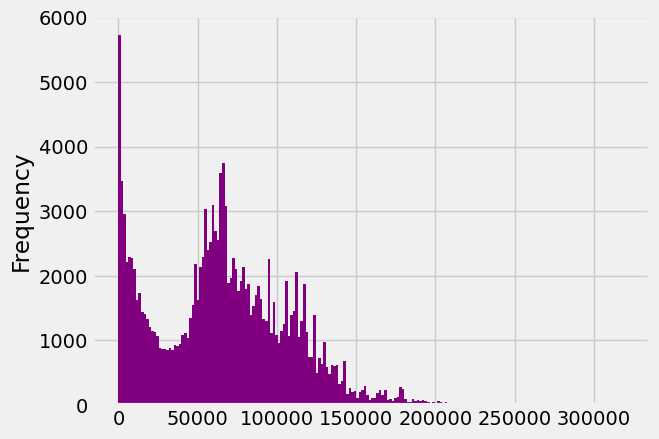
df.plot(kind="hist", bins=100)<Axes: ylabel='Frequency'>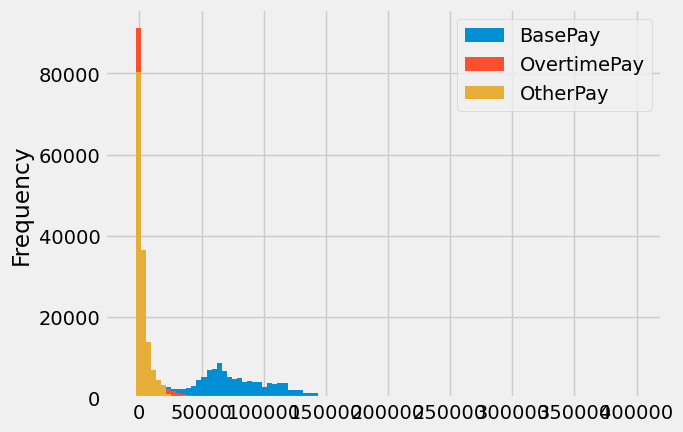
df.plot.hist(title="SF Salaries")<Axes: title={'center': 'SF Salaries'}, ylabel='Frequency'>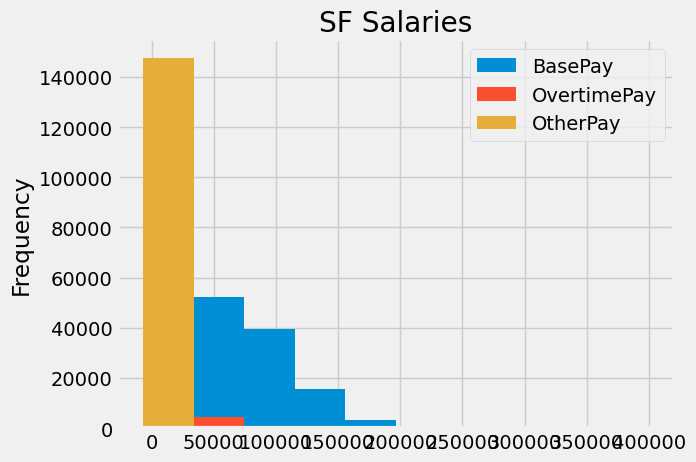
df.hist()array([[<Axes: title={'center': 'BasePay'}>,
<Axes: title={'center': 'OvertimePay'}>],
[<Axes: title={'center': 'OtherPay'}>, <Axes: >]], dtype=object)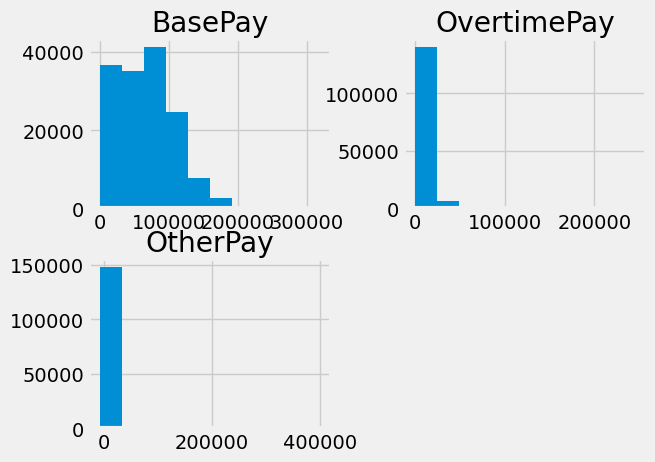
Box Plots
df.plot(kind="box")<Axes: >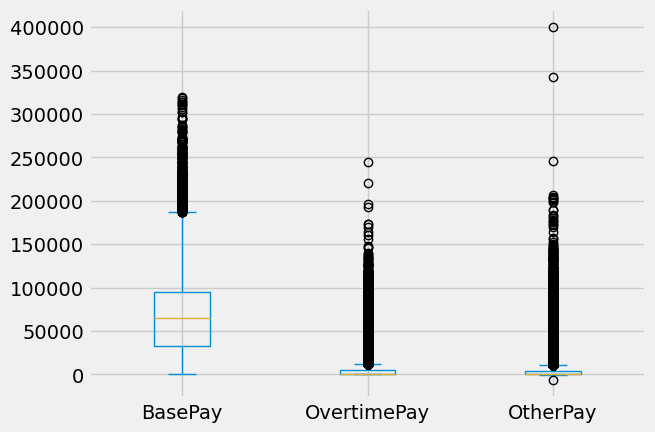
df.boxplot()<Axes: >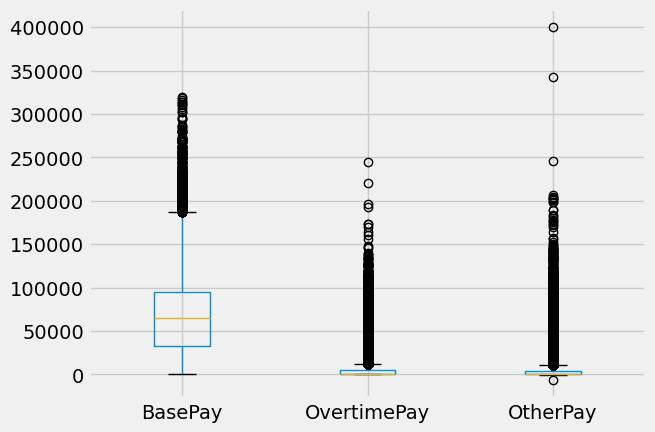
houses.bedrooms.plot(kind="box", showfliers=False)<Axes: >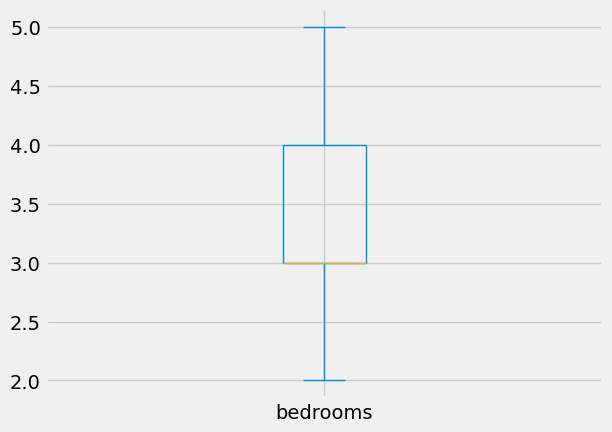
houses[["bedrooms", "bathrooms"]].boxplot(showfliers=False)<Axes: >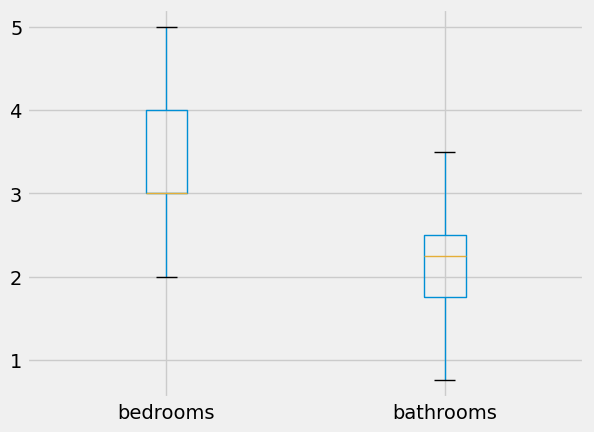
Line Plots
ufos.year.value_counts().sort_index().plot(kind="line", color="olive", linestyle=":")<Axes: xlabel='year'>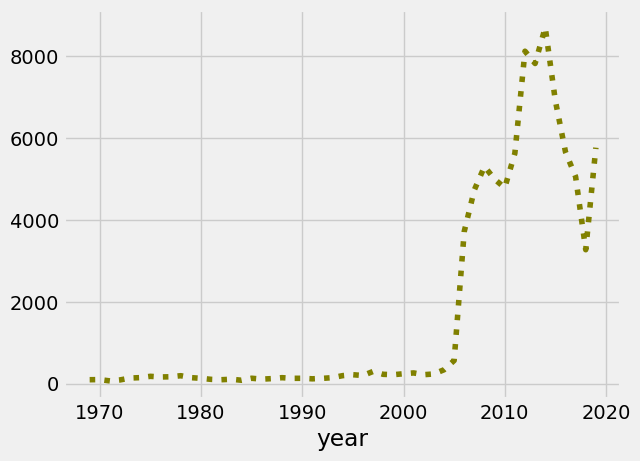
houses.plot.line(x="bedrooms", y="price")<Axes: xlabel='bedrooms'>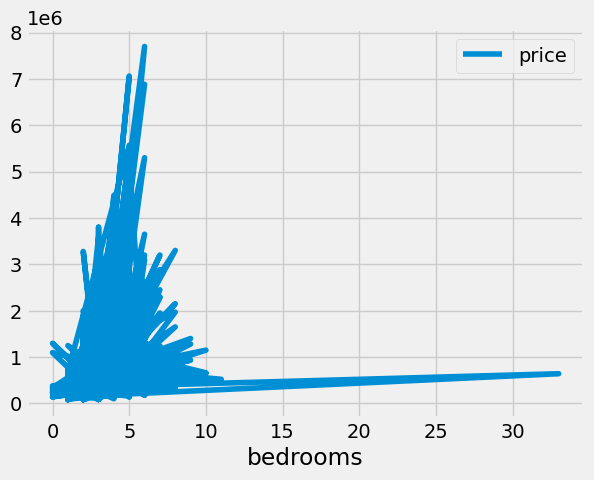
Scatter Plots
houses.plot.scatter(x="bedrooms", y="bathrooms")<Axes: xlabel='bedrooms', ylabel='bathrooms'>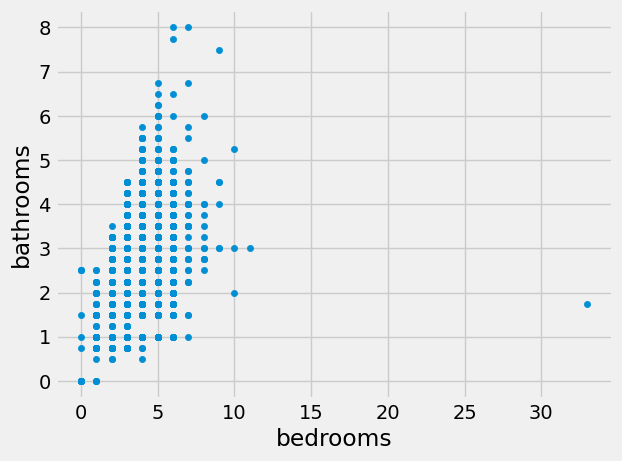
houses.plot.scatter(x="bedrooms", y="bathrooms", marker="X")<Axes: xlabel='bedrooms', ylabel='bathrooms'>
ufos[ufos["state"] == "CA"].year.value_counts().sort_index().plot(label="CA")
ufos[ufos["state"] == "TX"].year.value_counts().sort_index().plot(label="TX")
plt.legend(loc="upper left")
plt.title("UFO Sighting By State")
plt.xlabel("Year")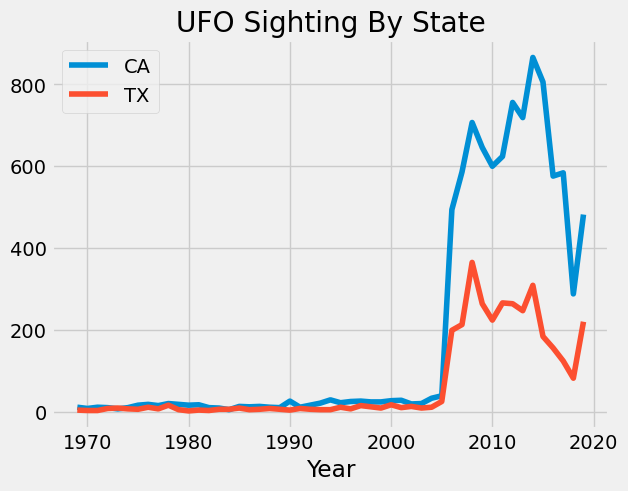
ufos["shape"].value_counts()shape
light 18230
circle 10130
triangle 7910
fireball 7095
unknown 6182
sphere 6065
other 5749
disk 4522
oval 3857
formation 2842
changing 2112
cigar 1990
flash 1675
rectangle 1597
cylinder 1374
diamond 1273
chevron 953
teardrop 767
egg 666
cone 349
cross 289
Name: count, dtype: int64ufos[ufos["shape"] == "formation"].year.value_counts().sort_index().plot(label="formation")
ufos[ufos["shape"] == "oval"].year.value_counts().sort_index().plot(label="oval")
# ufos[ufos["shape"] == "light"].year.value_counts().sort_index().plot(label="light")
# ufos[ufos["shape"] == "circle"].year.value_counts().sort_index().plot(label="circle")
# ufos[ufos["shape"] == "fireball"].year.value_counts().sort_index().plot(label="fireball")
ufos[ufos["shape"] == "disk"].year.value_counts().sort_index().plot(label="disk")
plt.xlim(2000,2020)
plt.legend(loc="upper left")
plt.title("UFO Sighting By State")
plt.xlabel("Year")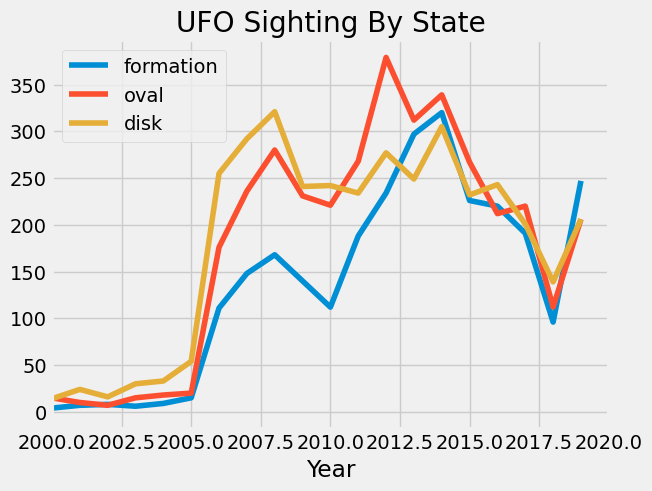
ufos[ufos["shape"] == "formation"].year.value_counts().sort_index().plot(label="formation")
ufos[ufos["shape"] == "oval"].year.value_counts().sort_index().plot(label="oval")
ufos[ufos["shape"] == "light"].year.value_counts().sort_index().plot(label="light")
# ufos[ufos["shape"] == "circle"].year.value_counts().sort_index().plot(label="circle")
ufos[ufos["shape"] == "fireball"].year.value_counts().sort_index().plot(label="fireball")
ufos[ufos["shape"] == "disk"].year.value_counts().sort_index().plot(label="disk")
# plt.xlim(2000,2020)
plt.legend(loc="upper left")
plt.title("UFO Sighting By State")
plt.xlabel("Year")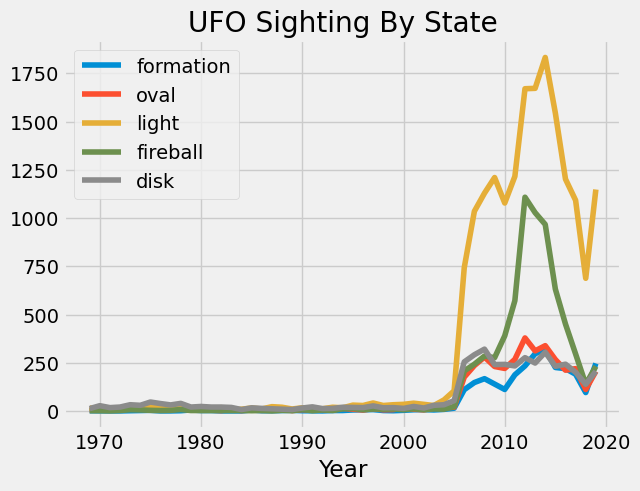
ufos[ufos["shape"] == "formation"].year.value_counts().sort_index().plot(label="formation")
ufos[ufos["shape"] == "oval"].year.value_counts().sort_index().plot(label="oval")
ufos[ufos["shape"] == "light"].year.value_counts().sort_index().plot(label="light")
# ufos[ufos["shape"] == "circle"].year.value_counts().sort_index().plot(label="circle")
ufos[ufos["shape"] == "fireball"].year.value_counts().sort_index().plot(label="fireball")
ufos[ufos["shape"] == "disk"].year.value_counts().sort_index().plot(label="disk")
# plt.xlim(2000,2020)
plt.legend(loc="upper left")
plt.title("UFO Sighting By State")
plt.xlabel("Year")ufos[ufos["shape"] == "formation"].month.value_counts().sort_index().plot(label="formation")
ufos[ufos["shape"] == "fireball"].month.value_counts().sort_index().plot(label="fireball")
ufos[ufos["shape"] == "sphere"].month.value_counts().sort_index().plot(label="sphere")
ufos[ufos["shape"] == "oval"].month.value_counts().sort_index().plot(label="oval")
plt.legend()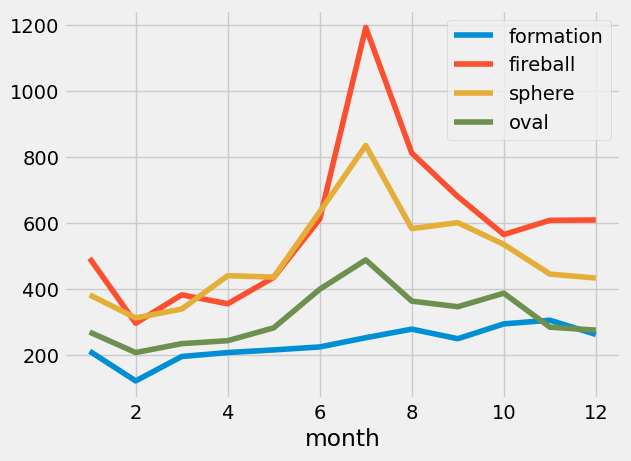
ufos["shape"].value_counts()shape
light 18230
circle 10130
triangle 7910
fireball 7095
unknown 6182
sphere 6065
other 5749
disk 4522
oval 3857
formation 2842
changing 2112
cigar 1990
flash 1675
rectangle 1597
cylinder 1374
diamond 1273
chevron 953
teardrop 767
egg 666
cone 349
cross 289
Name: count, dtype: int64ufos[ufos["shape"] == "formation"].date_time.dt.date.value_counts().sort_index().plot(label="formation")
ufos[ufos["shape"] != "formation"].date_time.dt.date.value_counts().sort_index().plot(label="all")<Axes: xlabel='date_time'>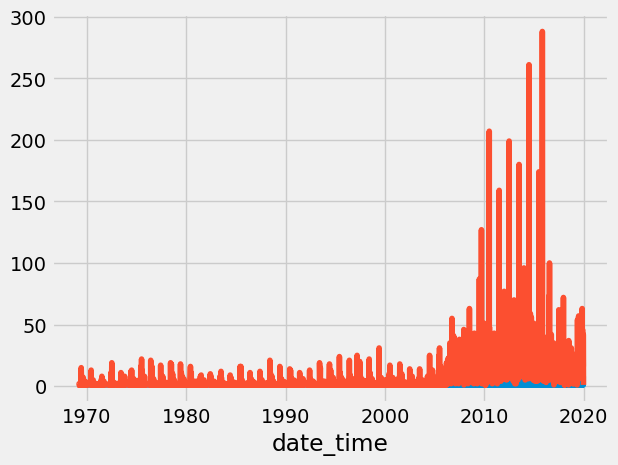
ufos[ufos["shape"] == "formation"].date_time.dt.date.value_counts().sort_index().plot()
# ufos[ufos["shape"] == "cigar"].date_time.dt.date.value_counts().sort_index().plot()
# ufos[ufos["shape"] == "fireball"].date_time.dt.date.value_counts().sort_index().plot()
# ufos[ufos["shape"] == "sphere"].date_time.dt.date.value_counts().sort_index().plot()
# ufos[ufos["shape"] == "sphere"].date_time.dt.date.value_counts().sort_index().plot()
ufos[ufos["shape"] != "formation"].date_time.dt.date.value_counts().sort_index().plot()
plt.xlim("2019-04-01", "2019-12-31")(np.float64(17987.0), np.float64(18261.0))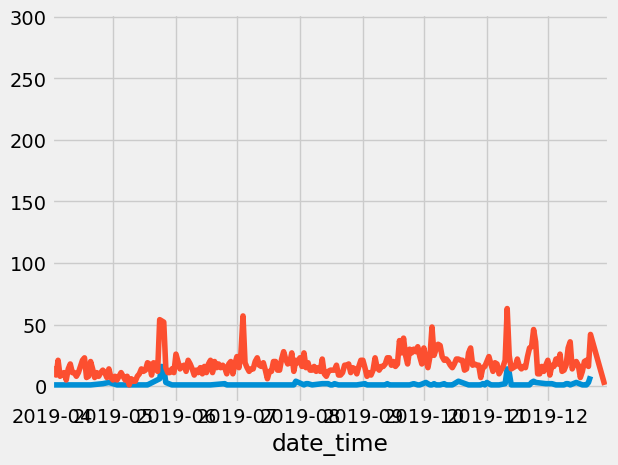
ufosLoading...
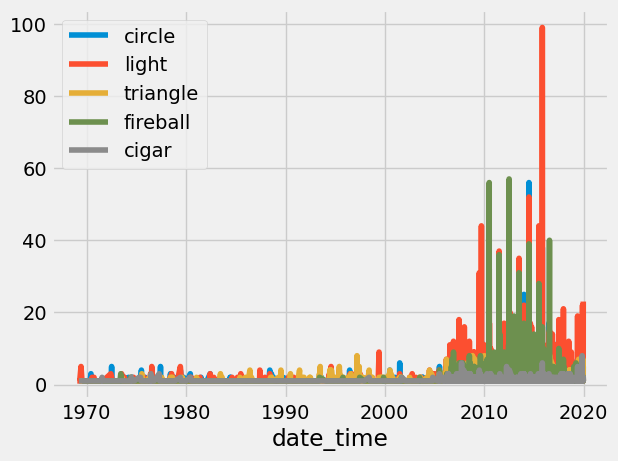
ufos[ufos["shape"] == "circle"].date_time.dt.date.value_counts().sort_index().plot(label="circle")
ufos[ufos["shape"] == "light"].date_time.dt.date.value_counts().sort_index().plot(label="light")
ufos[ufos["shape"] == "triangle"].date_time.dt.date.value_counts().sort_index().plot(label="triangle")
ufos[ufos["shape"] == "fireball"].date_time.dt.date.value_counts().sort_index().plot(label="fireball")
ufos[ufos["shape"] == "cigar"].date_time.dt.date.value_counts().sort_index().plot(label="cigar")
plt.legend()
ufos[ufos["shape"] == "circle"].year.value_counts().sort_index().plot(label="circle")
# ufos[ufos["shape"] == "light"].year.value_counts().sort_index().plot(label="light")
ufos[ufos["shape"] == "triangle"].year.value_counts().sort_index().plot(label="triangle")
ufos[ufos["shape"] == "fireball"].year.value_counts().sort_index().plot(label="fireball")
ufos[ufos["shape"] == "cigar"].year.value_counts().sort_index().plot(label="cigar")
ufos[ufos["shape"] == "formation"].year.value_counts().sort_index().plot(label="formation")
plt.legend()
plt.xlim(2010,2018)
(2010.0, 2018.0)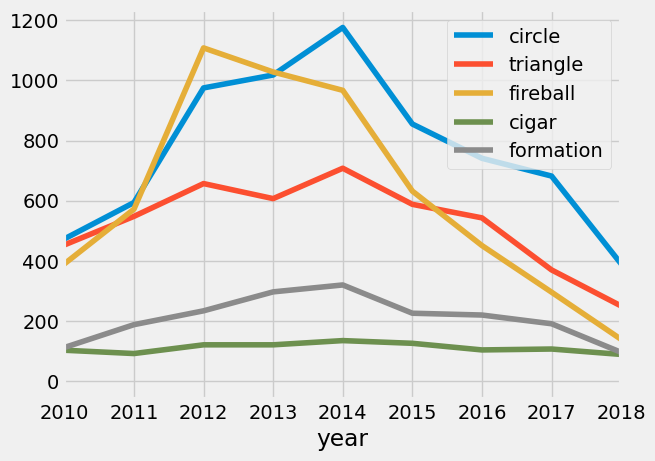
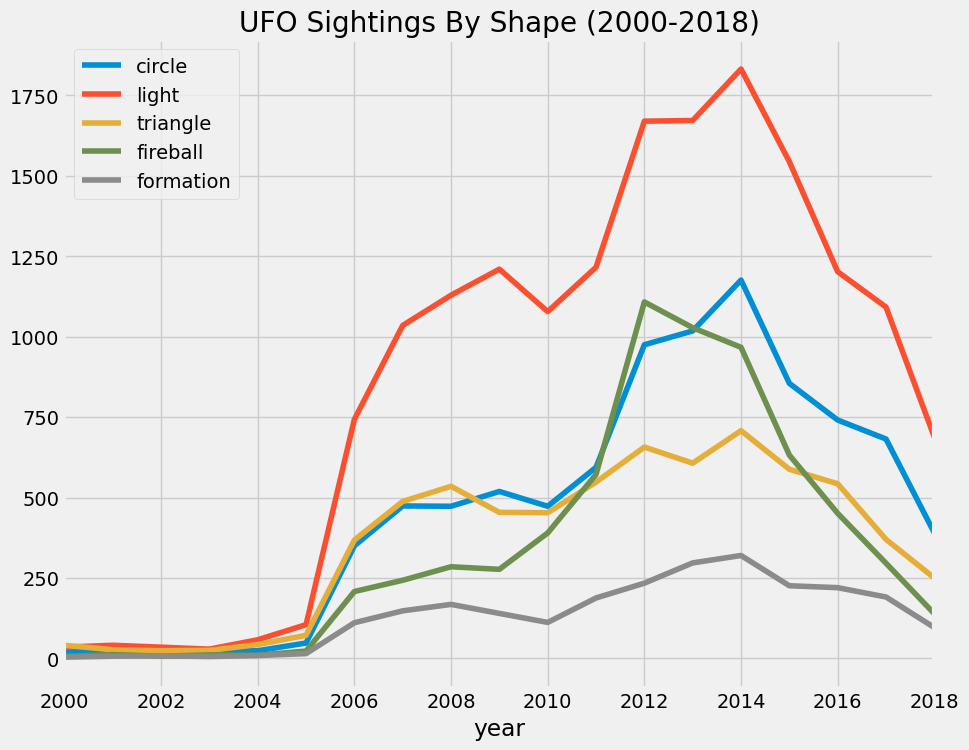
plt.figure(figsize=(10,8))
ufos[ufos["shape"] == "circle"].year.value_counts().sort_index().plot(label="circle")
ufos[ufos["shape"] == "light"].year.value_counts().sort_index().plot(label="light")
ufos[ufos["shape"] == "triangle"].year.value_counts().sort_index().plot(label="triangle")
ufos[ufos["shape"] == "fireball"].year.value_counts().sort_index().plot(label="fireball")
ufos[ufos["shape"] == "formation"].year.value_counts().sort_index().plot(label="formation")
plt.legend()
plt.xlim(2000,2018)
plt.title("UFO Sightings By Shape (2000-2018)")
ufos[ufos["shape"] == "light"].year.value_counts().sort_index().plot(label="light", figsize=(10,8), title="UFO Sightings By Shape")
ufos[ufos["shape"] == "fireball"].year.value_counts().sort_index().plot(label="fireball")
ufos[ufos["shape"] == "circle"].year.value_counts().sort_index().plot(label="circle")
ufos[ufos["shape"] == "triangle"].year.value_counts().sort_index().plot(label="triangle")
ufos[ufos["shape"] == "formation"].year.value_counts().sort_index().plot(label="formation")
plt.xlim(2000, 2019)
plt.legend()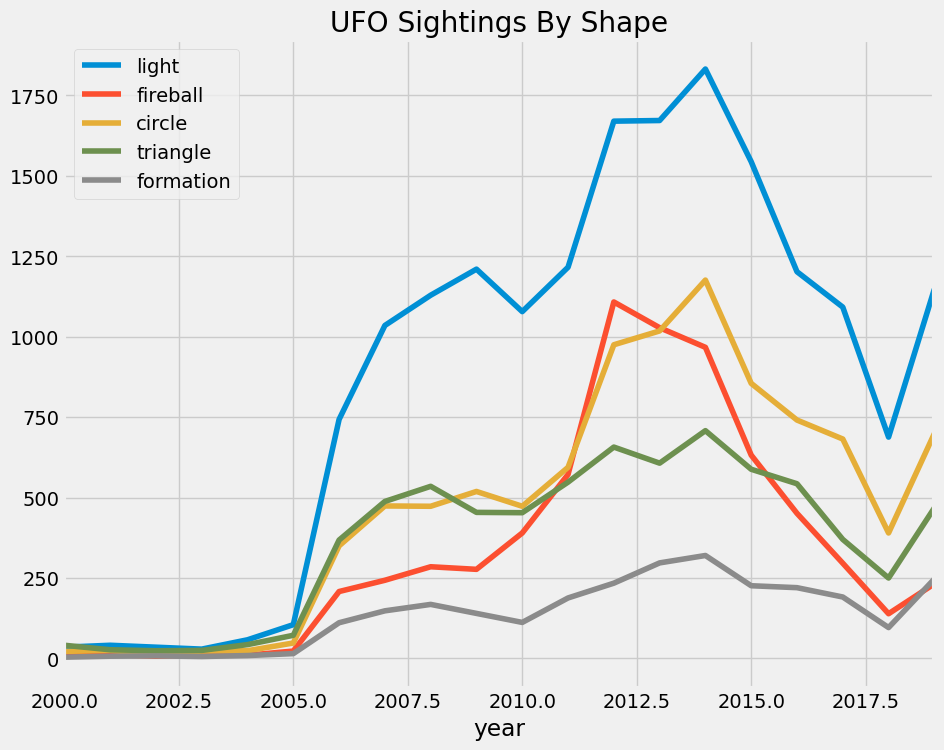
Subplots
df.plot(kind="hist")<Axes: ylabel='Frequency'>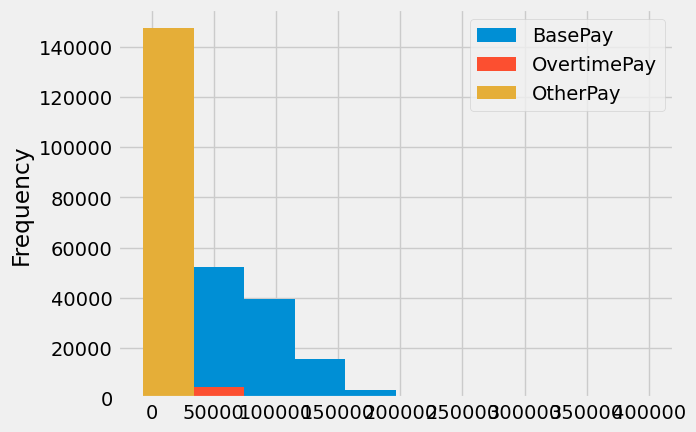
df.plot(kind="hist", subplots=True, sharex=False, figsize=(5,5))
plt.tight_layout()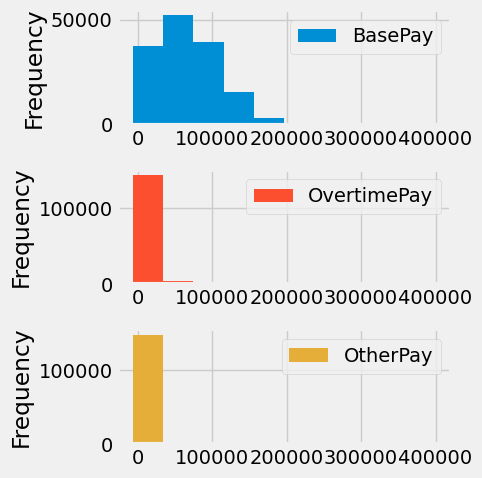
axs = df.plot(kind="hist", subplots=True, sharex=False, layout=(1,3), figsize=(10,3), bins=30)
plt.tight_layout()
axs[0][2].set_xlim(0,20000)
axs[0][1].set_title("Middle")
axs[0][0].set_title("First")
axs[0][2].set_title("Third")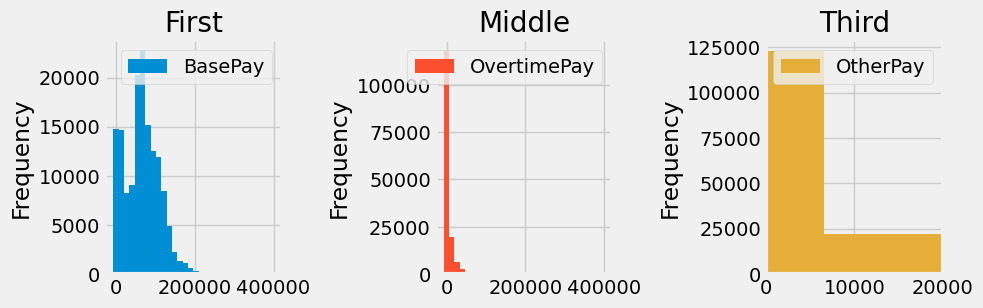
ufos.year.value_counts().sort_index().plot()<Axes: xlabel='year'>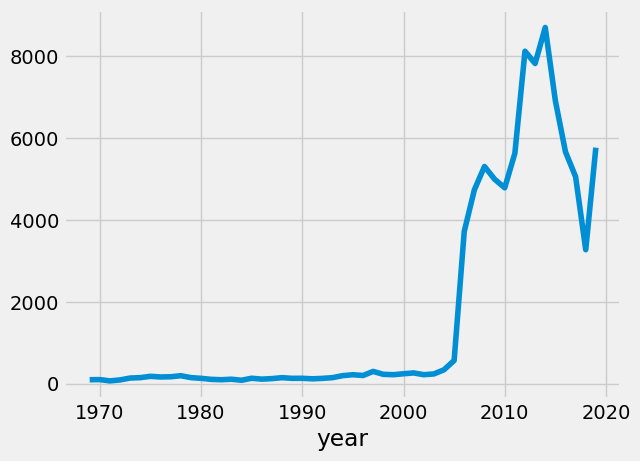
ufos.month.value_counts().sort_index().plot(kind="bar")<Axes: xlabel='month'>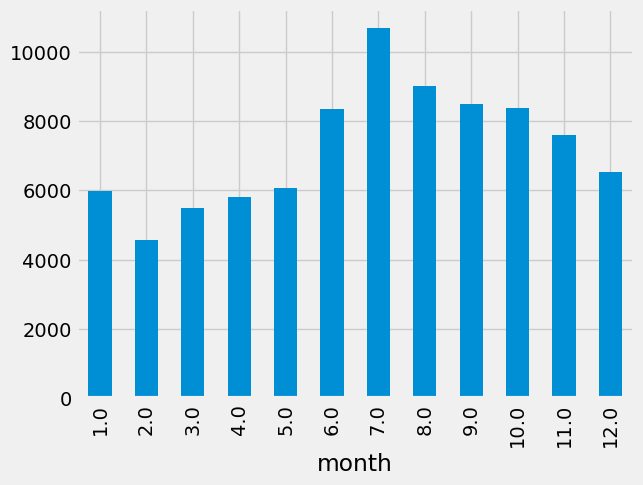
import pandas as pd
titanic = pd.read_csv("data/titanic.csv")
titanic["age"] = pd.to_numeric(titanic["age"], errors="coerce")plt.hist(titanic["age"])(array([ 72., 62., 274., 250., 161., 108., 65., 41., 10., 3.]),
array([ 0.1667 , 8.15003, 16.13336, 24.11669, 32.10002, 40.08335,
48.06668, 56.05001, 64.03334, 72.01667, 80. ]),
<BarContainer object of 10 artists>)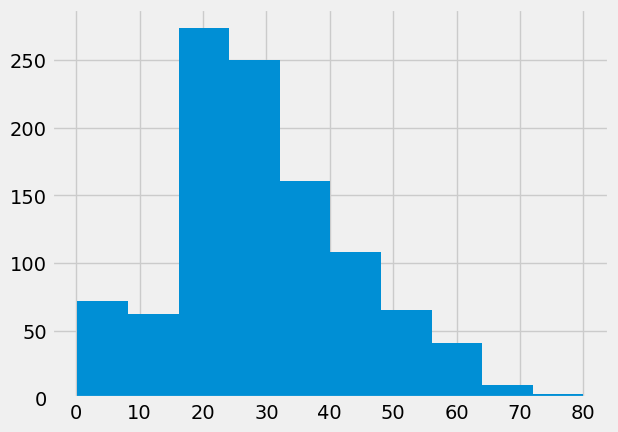
first_class = titanic[titanic["pclass"] == 1]["age"]
second_class = titanic[titanic["pclass"] == 2]["age"]
third_class = titanic[titanic["pclass"] == 3]["age"]
plt.hist(first_class, label="1st Class", alpha=0.5, color="#f1c40f", bins=20)
plt.hist(second_class, label="2nd Class", alpha=0.5, color="#3498db", bins=20)
plt.hist(third_class, label="3rd Class", alpha=0.5, color="#e74c3c", bins=20)
plt.legend()
plt.title("Titanic Passenger Ages")
plt.xlabel("Passenger Age")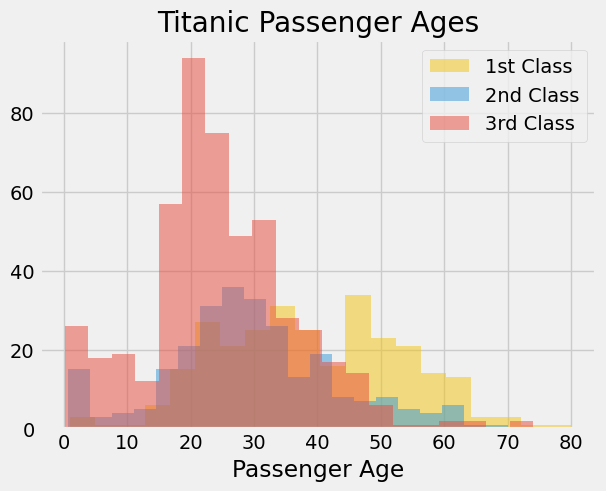
The Object-Oriented Approach
fig, axs = plt.subplots(1,2)
axs[0].hist(first_class)
axs[1].hist(second_class)
axs[0].hist(third_class)
axs[0].set_title("My Title")
axs[0].set_xlabel("Age")
axs[1].set_title("My Other Title")
fig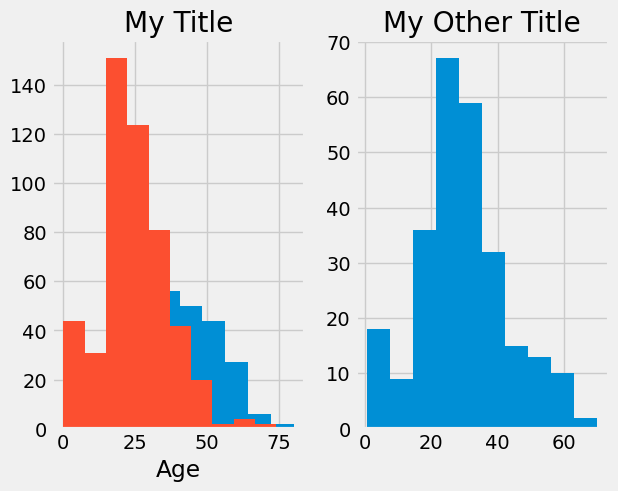
Manual Subplots
fig, axs = plt.subplots(1,2)
ufos.year.value_counts().sort_index().plot(ax=axs[0])
axs[0].set_title("Sightings By Year")
ufos.month.value_counts().sort_index().plot(kind="bar", ax=axs[1])
axs[1].set_title("Sightings By Month")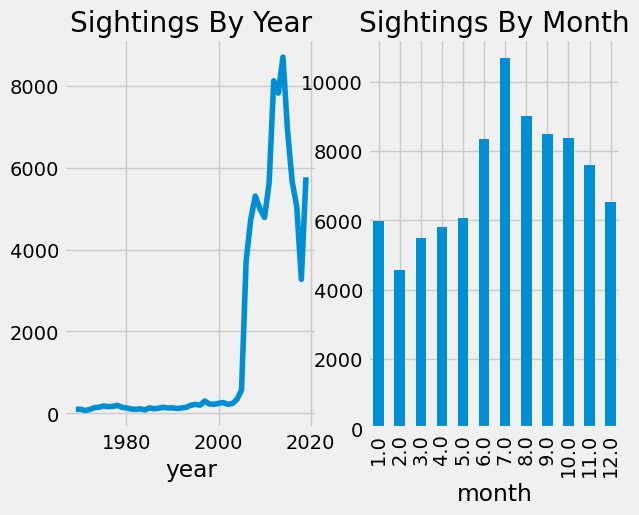
months = {1: 'Jan', 2: 'Feb', 3: 'Mar', 4: 'Apr', 5: 'May', 6: 'Jun',
7: 'Jul', 8: 'Aug', 9: 'Sep', 10: 'Oct', 11: 'Nov', 12: 'Dec'}
fig, axs = plt.subplots(2, 3, figsize=(14, 8))
fig.suptitle("UFO sightings by month", fontsize=14)
fig.tight_layout(pad=2)
ufos[ufos.year == 2014].month.value_counts().sort_index().rename(months).plot(kind="bar", ax=axs[0][0], title="2014")
ufos[ufos.year == 2015].month.value_counts().sort_index().rename(months).plot(kind="bar", ax=axs[0][1], title="2015")
ufos[ufos.year == 2016].month.value_counts().sort_index().rename(months).plot(kind="bar", ax=axs[0][2], title="2016")
ufos[ufos.year == 2017].month.value_counts().sort_index().rename(months).plot(kind="bar", ax=axs[1][0], title="2017")
ufos[ufos.year == 2018].month.value_counts().sort_index().rename(months).plot(kind="bar", ax=axs[1][1], title="2018")
ufos[ufos.year == 2019].month.value_counts().sort_index().rename(months).plot(kind="bar", ax=axs[1][2], title="2019")
plt.tight_layout()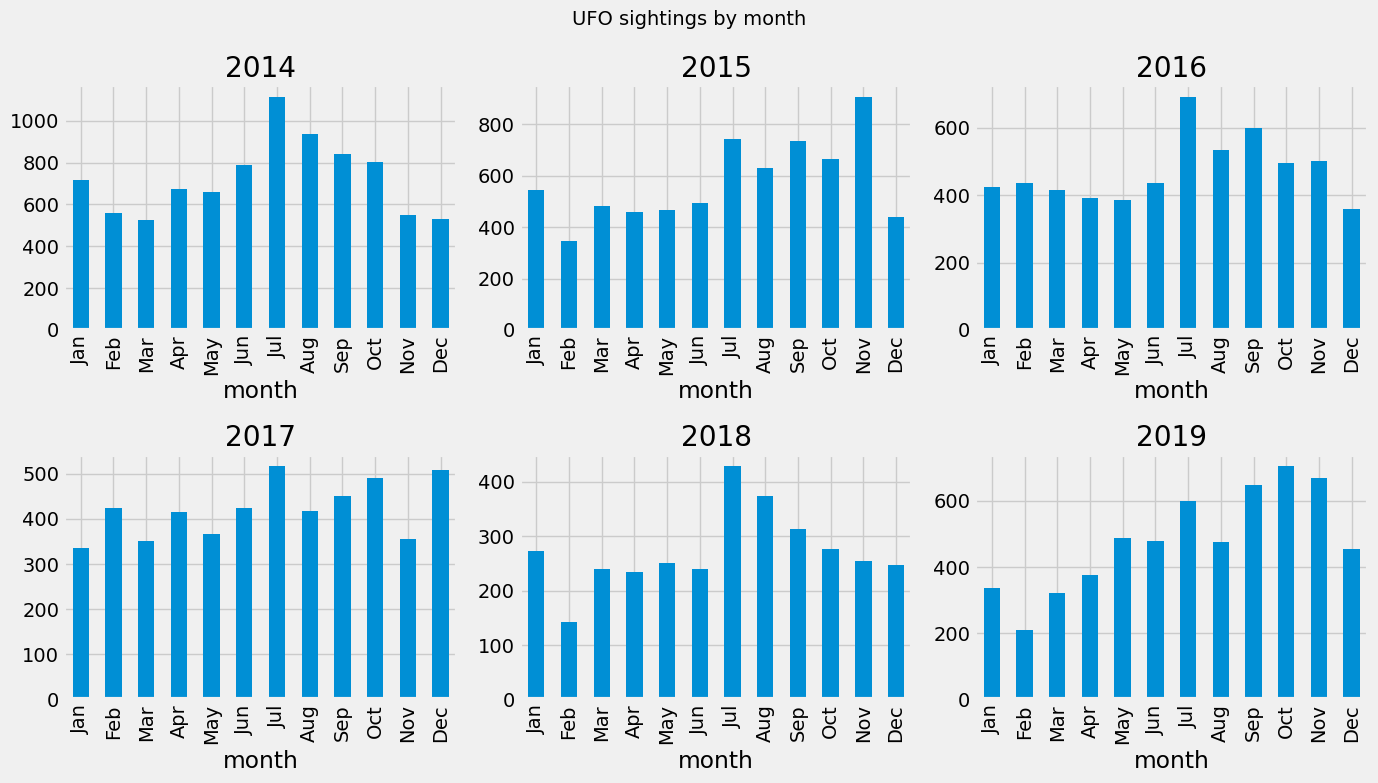
Savefig()
ufos[ufos["shape"] == "light"].year.value_counts().sort_index().plot(label="light", figsize=(10,8), title="UFO Sightings By Shape")
ufos[ufos["shape"] == "fireball"].year.value_counts().sort_index().plot(label="fireball")
ufos[ufos["shape"] == "circle"].year.value_counts().sort_index().plot(label="circle")
ufos[ufos["shape"] == "triangle"].year.value_counts().sort_index().plot(label="triangle")
ufos[ufos["shape"] == "formation"].year.value_counts().sort_index().plot(label="formation")

plt.xlim(2000, 2019)
plt.legend()
plt.savefig("UFO_Shapes")months = {1: 'Jan', 2: 'Feb', 3: 'Mar', 4: 'Apr', 5: 'May', 6: 'Jun',
7: 'Jul', 8: 'Aug', 9: 'Sep', 10: 'Oct', 11: 'Nov', 12: 'Dec'}
fig, axs = plt.subplots(2, 3, figsize=(14, 8))
fig.suptitle("UFO sightings by month", fontsize=14)
fig.tight_layout(pad=2)
ufos[ufos.year == 2014].month.value_counts().sort_index().rename(months).plot(kind="bar", ax=axs[0][0], title="2014")
ufos[ufos.year == 2015].month.value_counts().sort_index().rename(months).plot(kind="bar", ax=axs[0][1], title="2015")
ufos[ufos.year == 2016].month.value_counts().sort_index().rename(months).plot(kind="bar", ax=axs[0][2], title="2016")
ufos[ufos.year == 2017].month.value_counts().sort_index().rename(months).plot(kind="bar", ax=axs[1][0], title="2017")
ufos[ufos.year == 2018].month.value_counts().sort_index().rename(months).plot(kind="bar", ax=axs[1][1], title="2018")
ufos[ufos.year == 2019].month.value_counts().sort_index().rename(months).plot(kind="bar", ax=axs[1][2], title="2019")
plt.tight_layout()
plt.savefig("UFO_By_Month")