import pandas as pd
import matplotlib.pyplot as plt
import seaborn as sns
# "white", "dark", "whitegrid", "darkgrid", "ticks"tips = sns.load_dataset("tips")sns.set_style("white")
sns.scatterplot(data=tips, x="total_bill", y="tip")<Axes: xlabel='total_bill', ylabel='tip'>
sns.set_style("whitegrid")
sns.scatterplot(data=tips, x="total_bill", y="tip")
<Axes: xlabel='total_bill', ylabel='tip'>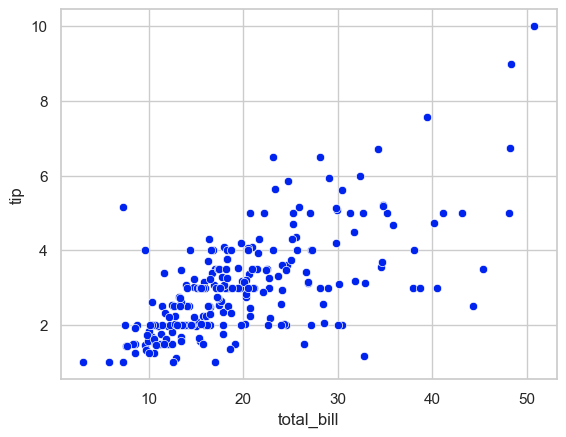
sns.set_style("dark")
sns.scatterplot(data=tips, x="total_bill", y="tip")
<Axes: xlabel='total_bill', ylabel='tip'>
sns.set_style("darkgrid")
sns.scatterplot(data=tips, x="total_bill", y="tip")
<Axes: xlabel='total_bill', ylabel='tip'>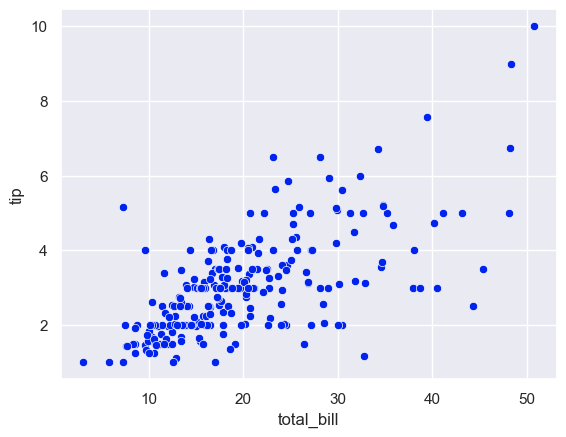
sns.set_style("ticks")
sns.scatterplot(data=tips, x="total_bill", y="tip")
<Axes: xlabel='total_bill', ylabel='tip'>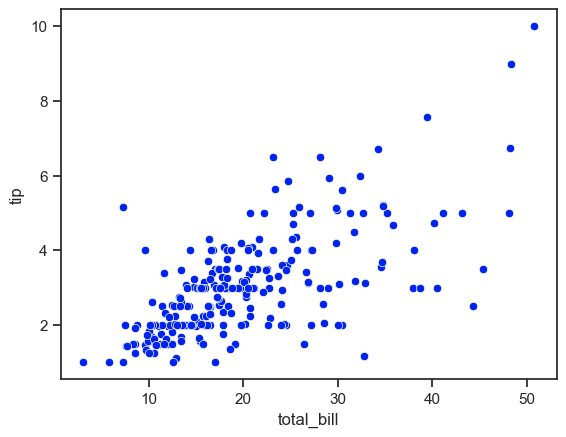
sns.lineplot(data=tips, x="total_bill", y="tip")<Axes: xlabel='total_bill', ylabel='tip'>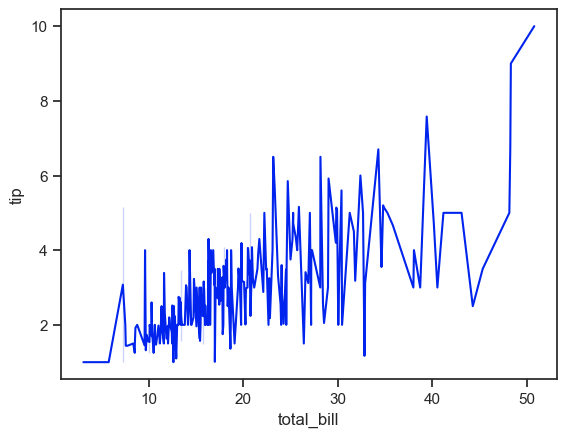
sns.set_theme(style="darkgrid")sns.lineplot(data=tips, x="total_bill", y="tip")<Axes: xlabel='total_bill', ylabel='tip'>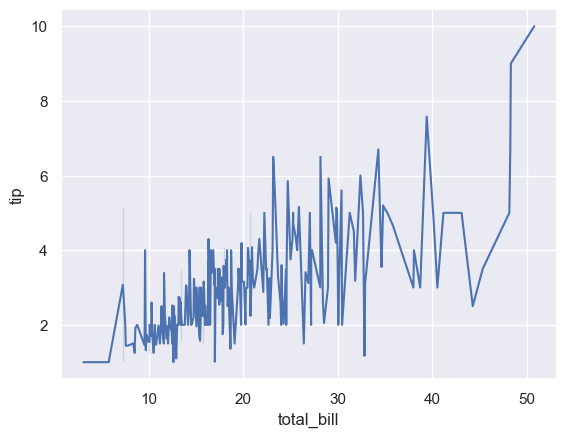
sns.axes_style(){'axes.facecolor': '#EAEAF2',
'axes.edgecolor': 'white',
'axes.grid': True,
'axes.axisbelow': True,
'axes.labelcolor': '.15',
'figure.facecolor': 'white',
'grid.color': 'white',
'grid.linestyle': '-',
'text.color': '.15',
'xtick.color': '.15',
'ytick.color': '.15',
'xtick.direction': 'out',
'ytick.direction': 'out',
'lines.solid_capstyle': <CapStyle.round: 'round'>,
'patch.edgecolor': 'w',
'patch.force_edgecolor': True,
'image.cmap': 'rocket',
'font.family': ['sans-serif'],
'font.sans-serif': ['Arial',
'DejaVu Sans',
'Liberation Sans',
'Bitstream Vera Sans',
'sans-serif'],
'xtick.bottom': False,
'xtick.top': False,
'ytick.left': False,
'ytick.right': False,
'axes.spines.left': True,
'axes.spines.bottom': True,
'axes.spines.right': True,
'axes.spines.top': True}sns.lineplot(data=tips, x="total_bill", y="tip")<Axes: xlabel='total_bill', ylabel='tip'>sns.set_style({'axes.facecolor': '#FC427B', 'grid.color': '#9AECDB'})
sns.lineplot(data=tips, x="total_bill", y="tip")<Axes: xlabel='total_bill', ylabel='tip'>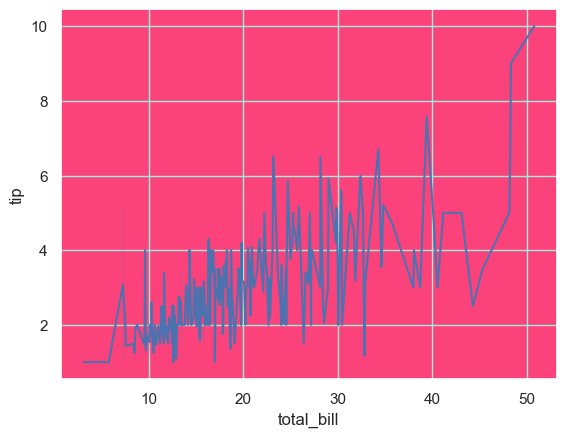
sns.set_style("ticks", {'axes.facecolor': '#FC427B', 'grid.color': '#9AECDB'})sns.scatterplot(data=tips, x="total_bill", y="tip")<Axes: xlabel='total_bill', ylabel='tip'>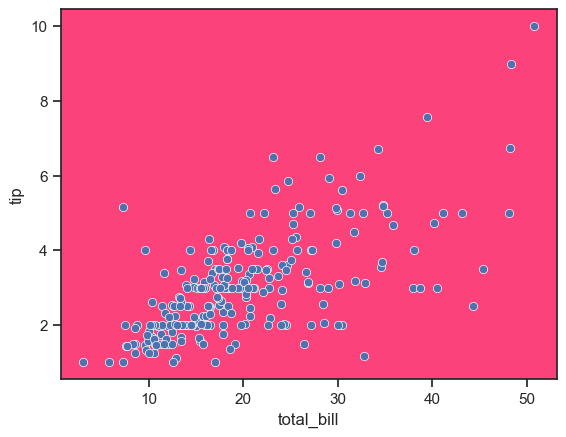
sns.set_style("darkgrid")sns.scatterplot(data=tips, x="total_bill", y="tip")<Axes: xlabel='total_bill', ylabel='tip'>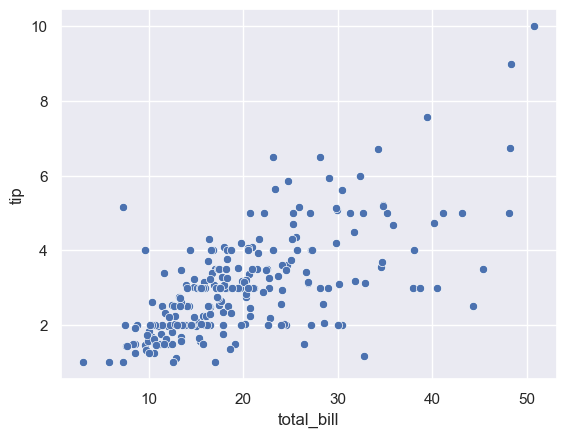
Despine
sns.set_style("white")sns.histplot(data=tips,x="total_bill")
sns.despine()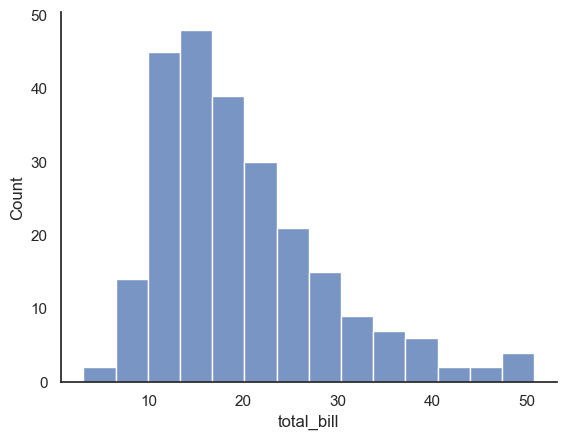
sns.histplot(data=tips,x="total_bill")
sns.despine(bottom=True, top=False)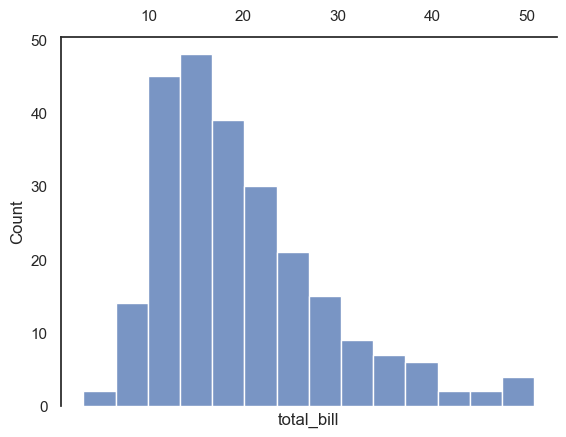
Existing Palettes
# (deep, muted, bright, pastel, dark, colorblind)
sns.set_palette("muted")
sns.barplot(data=tips, x="day", y="total_bill")
<Axes: xlabel='day', ylabel='total_bill'>
sns.set_palette("pastel")
sns.barplot(data=tips, x="day", y="total_bill")
<Axes: xlabel='day', ylabel='total_bill'>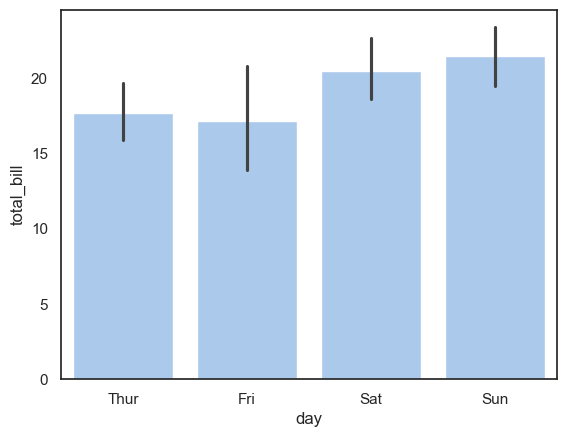
sns.set_palette("dark")
sns.barplot(data=tips, x="day", y="total_bill")
<Axes: xlabel='day', ylabel='total_bill'>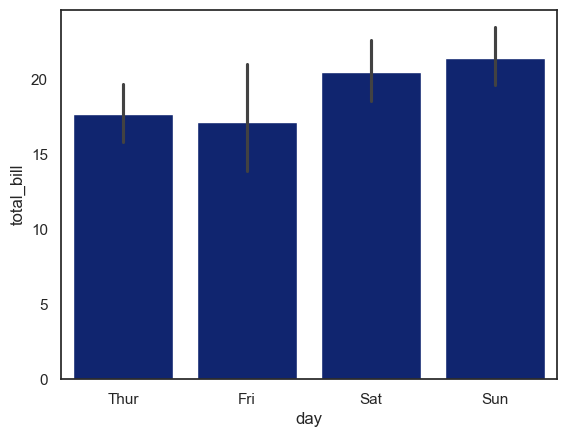
sns.set_palette("winter")
# Accent', 'Accent_r', 'Blues', 'Blues_r', 'BrBG', 'BrBG_r', 'BuGn', 'BuGn_r', 'BuPu', 'BuPu_r', 'CMRmap', 'CMRmap_r', 'Dark2', 'Dark2_r', 'GnBu', 'GnBu_r', 'Greens', 'Greens_r', 'Greys', 'Greys_r', 'OrRd', 'OrRd_r', 'Oranges', 'Oranges_r', 'PRGn', 'PRGn_r', 'Paired', 'Paired_r', 'Pastel1', 'Pastel1_r', 'Pastel2', 'Pastel2_r', 'PiYG', 'PiYG_r', 'PuBu', 'PuBuGn', 'PuBuGn_r', 'PuBu_r', 'PuOr', 'PuOr_r', 'PuRd', 'PuRd_r', 'Purples', 'Purples_r', 'RdBu', 'RdBu_r', 'RdGy', 'RdGy_r', 'RdPu', 'RdPu_r', 'RdYlBu', 'RdYlBu_r', 'RdYlGn', 'RdYlGn_r', 'Reds', 'Reds_r', 'Set1', 'Set1_r', 'Set2', 'Set2_r', 'Set3', 'Set3_r', 'Spectral', 'Spectral_r', 'Wistia', 'Wistia_r', 'YlGn', 'YlGnBu', 'YlGnBu_r', 'YlGn_r', 'YlOrBr', 'YlOrBr_r', 'YlOrRd', 'YlOrRd_r', 'afmhot', 'afmhot_r', 'autumn', 'autumn_r', 'binary', 'binary_r', 'bone', 'bone_r', 'brg', 'brg_r', 'bwr', 'bwr_r', 'cividis', 'cividis_r', 'cool', 'cool_r', 'coolwarm', 'coolwarm_r', 'copper', 'copper_r', 'crest', 'crest_r', 'cubehelix', 'cubehelix_r', 'flag', 'flag_r', 'flare', 'flare_r', 'gist_earth', 'gist_earth_r', 'gist_gray', 'gist_gray_r', 'gist_heat', 'gist_heat_r', 'gist_ncar', 'gist_ncar_r', 'gist_rainbow', 'gist_rainbow_r', 'gist_stern', 'gist_stern_r', 'gist_yarg', 'gist_yarg_r', 'gnuplot', 'gnuplot2', 'gnuplot2_r', 'gnuplot_r', 'gray', 'gray_r', 'hot', 'hot_r', 'hsv', 'hsv_r', 'icefire', 'icefire_r', 'inferno', 'inferno_r', 'jet', 'jet_r', 'magma', 'magma_r', 'mako', 'mako_r', 'nipy_spectral', 'nipy_spectral_r', 'ocean', 'ocean_r', 'pink', 'pink_r', 'plasma', 'plasma_r', 'prism', 'prism_r', 'rainbow', 'rainbow_r', 'rocket', 'rocket_r', 'seismic', 'seismic_r', 'spring', 'spring_r', 'summer', 'summer_r', 'tab10', 'tab10_r', 'tab20', 'tab20_r', 'tab20b', 'tab20b_r', 'tab20c', 'tab20c_r', 'terrain', 'terrain_r', 'turbo', 'turbo_r', 'twilight', 'twilight_r', 'twilight_shifted', 'twilight_shifted_r', 'viridis', 'viridis_r', 'vlag', 'vlag_r', 'winter', 'winter_r'
sns.color_palette("Blues")Loading...
sns.color_palette("ocean")Loading...
sns.color_palette("gist_rainbow")Loading...
sns.color_palette("terrain")Loading...
sns.set_palette("terrain")sns.barplot(data=tips, x="day", y="total_bill")<Axes: xlabel='day', ylabel='total_bill'>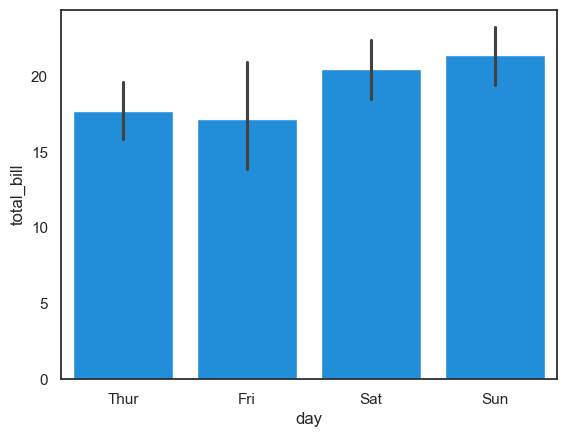
sns.scatterplot(data=tips, x="tip", y="total_bill", hue="sex")<Axes: xlabel='tip', ylabel='total_bill'>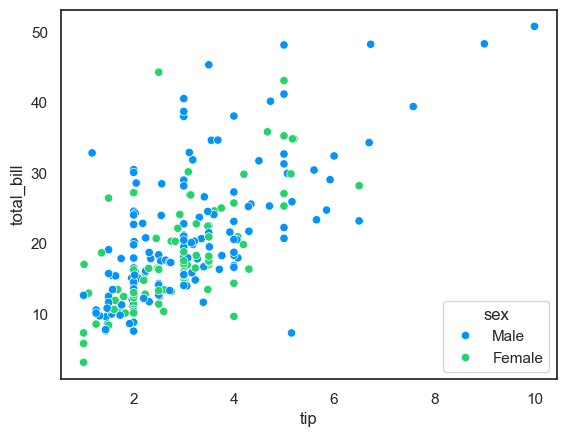
sns.barplot(data=tips, x="day", y="total_bill", palette="ocean")/tmp/ipykernel_51562/4050884747.py:1: FutureWarning:
Passing `palette` without assigning `hue` is deprecated and will be removed in v0.14.0. Assign the `x` variable to `hue` and set `legend=False` for the same effect.
sns.barplot(data=tips, x="day", y="total_bill", palette="ocean")
<Axes: xlabel='day', ylabel='total_bill'>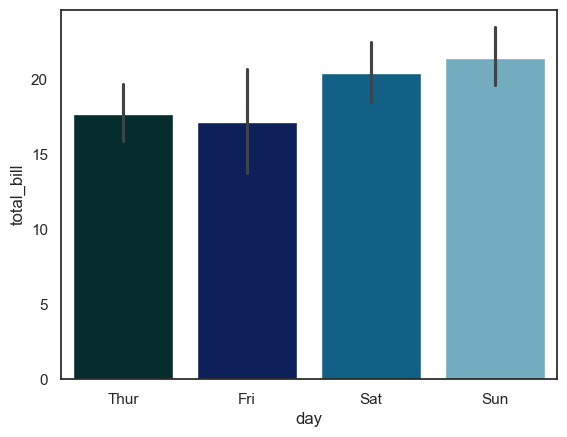
sns.barplot(data=tips, x="day", y="total_bill")<Axes: xlabel='day', ylabel='total_bill'>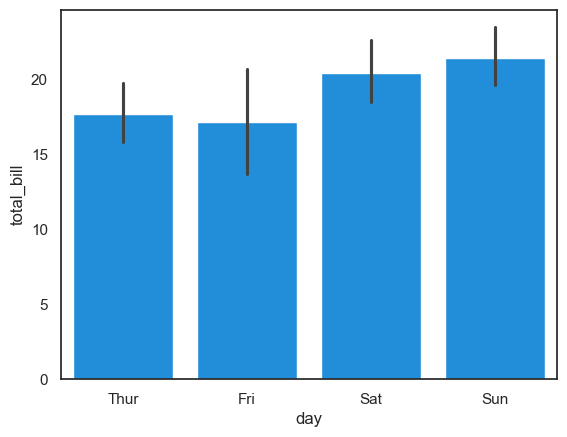
sns.kdeplot(data=tips, x="tip", color="magenta")<Axes: xlabel='tip', ylabel='Density'>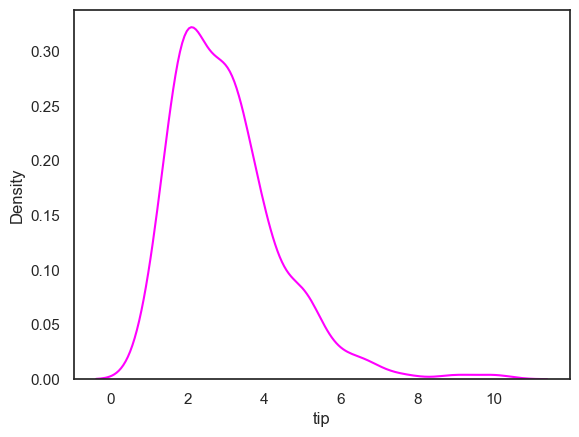
Custom Palettes
sns.color_palette("pastel", 6)Loading...
codes = ["#B33771", "#3B3B98", "#FD7272", "#9AECDB", "#D6A2E8"]
custom_pal = sns.color_palette(codes)
sns.barplot(data=tips, x="day", y="total_bill", palette=custom_pal)/tmp/ipykernel_51562/1581231354.py:1: FutureWarning:
Passing `palette` without assigning `hue` is deprecated and will be removed in v0.14.0. Assign the `x` variable to `hue` and set `legend=False` for the same effect.
sns.barplot(data=tips, x="day", y="total_bill", palette=custom_pal)
/tmp/ipykernel_51562/1581231354.py:1: UserWarning: The palette list has more values (5) than needed (4), which may not be intended.
sns.barplot(data=tips, x="day", y="total_bill", palette=custom_pal)
<Axes: xlabel='day', ylabel='total_bill'>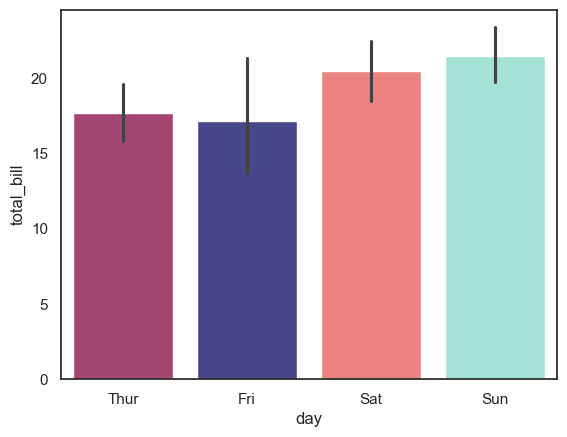
sns.light_palette("#eb2f06")Loading...
sns.dark_palette("#eb2f06")Loading...
diamonds = sns.load_dataset("diamonds")sns.histplot(
diamonds,
x="price", hue="cut",
multiple="stack",
log_scale=True,
palette=sns.dark_palette("#eb2f06", 5)
)<Axes: xlabel='price', ylabel='Count'>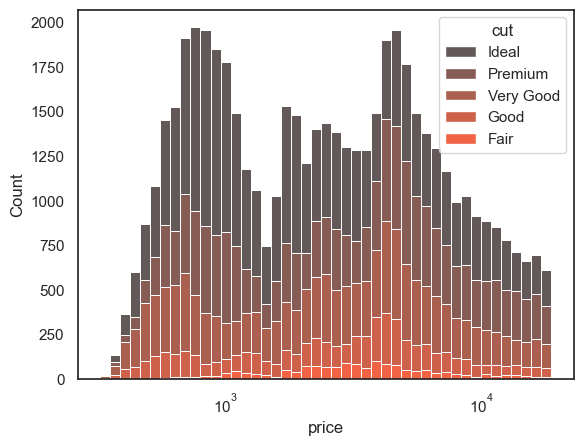
sns.histplot(
    diamonds,
    x="price", hue="cut",
    multiple="stack",
    log_scale=True,
    palette="dark:olive"
)
<Axes: xlabel='price', ylabel='Count'>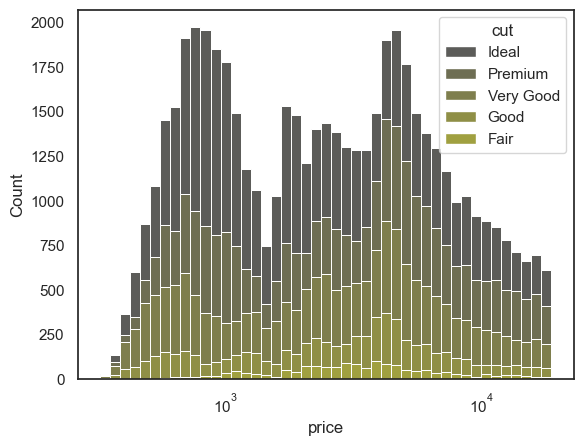
sns.blend_palette(["#4a69bd", "#e58e26"])Loading...