AKA Heirarchical Indexes
import pandas as pdcarstocks = pd.read_csv("data/car_stocks.csv")titanic = pd.read_csv("data/titanic.csv")
titanic['age'] = titanic["age"].replace(['?'], [None]).astype('float')
titanic['fare'] = titanic["fare"].replace(['?'], [None]).astype('float')s1 = titanic.groupby("sex")["age"].mean()s1.indexIndex(['female', 'male'], dtype='object', name='sex')Grouping By Multiple Columns!
df = titanic.groupby(["pclass", "sex"]).mean()df.indexMultiIndex([(1, 'female'),
(1, 'male'),
(2, 'female'),
(2, 'male'),
(3, 'female'),
(3, 'male')],
names=['pclass', 'sex'])titanic.indexRangeIndex(start=0, stop=1309, step=1)dfLoading...
titanic.groupby(["sex", "age"]).mean()Loading...
Creating Your Own MultiIndex
pops = pd.read_csv("data/state_pops.csv")pops.indexRangeIndex(start=0, stop=1272, step=1)pops.set_index("state")Loading...
pops.set_index("year")Loading...
pops.set_index(["state", "year"])Loading...
pops.set_index(["year", "state"])Loading...
pops.set_index(["state", "year"], inplace=True)popsLoading...
Sorting A MultiIndex
pops.sort_index()Loading...
pops.sort_index(ascending=False)Loading...
pops.sort_index(level=1)Loading...
pops.sort_index(level=[1,0],ascending=[False,True])Loading...
pops.sort_index(inplace=True)popsLoading...
loc [] with MultiIndexes
pops.loc["CA"]Loading...
pops.loc[["CA", "AK"]]Loading...
pops.loc["NM": "TX"]Loading...
pops.loc[("MT",1992)]population 825770.0
Name: (MT, 1992), dtype: float64pops.loc[("CA", 2013)]population 38332521.0
Name: (CA, 2013), dtype: float64pops.loc[("AK", 1990):("AK",1995)]Loading...
pops.info()<class 'pandas.core.frame.DataFrame'>
MultiIndex: 1272 entries, ('AK', 1990) to ('WY', 2013)
Data columns (total 1 columns):
# Column Non-Null Count Dtype
--- ------ -------------- -----
0 population 1262 non-null float64
dtypes: float64(1)
memory usage: 48.0+ KB
pops.loc[("AK", 2011):("AL",1993)]Loading...
# This won't work!
pops.loc[:,1990]
titanic.loc[19, "name"]'Beattie, Mr. Thomson'pops.loc[:, 1990, :]Loading...
pops.loc[:, [1990,1991], :]Loading...
pops.loc[slice(None), [1990,1991], :]Loading...
pops.loc[:,2013,:]Loading...
The .xs( ) Method
pops.xs(2013, level="year")Loading...
pops.xs(2013, level=1)Loading...
get_level_values( )
pops.index.levelsFrozenList([['AK', 'AL', 'AR', 'AZ', 'CA', 'CO', 'CT', 'DC', 'DE', 'FL', 'GA', 'HI', 'IA', 'ID', 'IL', 'IN', 'KS', 'KY', 'LA', 'MA', 'MD', 'ME', 'MI', 'MN', 'MO', 'MS', 'MT', 'NC', 'ND', 'NE', 'NH', 'NJ', 'NM', 'NV', 'NY', 'OH', 'OK', 'OR', 'PA', 'PR', 'RI', 'SC', 'SD', 'TN', 'TX', 'USA', 'UT', 'VA', 'VT', 'WA', 'WI', 'WV', 'WY'], [1990, 1991, 1992, 1993, 1994, 1995, 1996, 1997, 1998, 1999, 2000, 2001, 2002, 2003, 2004, 2005, 2006, 2007, 2008, 2009, 2010, 2011, 2012, 2013]])pops.index.get_level_values(0)Index(['AK', 'AK', 'AK', 'AK', 'AK', 'AK', 'AK', 'AK', 'AK', 'AK',
...
'WY', 'WY', 'WY', 'WY', 'WY', 'WY', 'WY', 'WY', 'WY', 'WY'],
dtype='object', name='state', length=1272)pops.index.get_level_values(1)Int64Index([1990, 1991, 1992, 1993, 1994, 1995, 1996, 1997, 1998, 1999,
...
2004, 2005, 2006, 2007, 2008, 2009, 2010, 2011, 2012, 2013],
dtype='int64', name='year', length=1272)pops.loc[:, [1990, 1992, 1994], :]Loading...
even_years = pops.index.get_level_values(1) % 2 == 0 len(even_years)1272len(pops)1272even_yearsarray([ True, False, True, ..., False, True, False])pops[even_years]Loading...
pops[pops["population"] % 2 == 0]Loading...
even_pops = pops["population"] % 2 == 0pops[even_years & even_pops]Loading...
ends_with_a = pops.index.get_level_values(0).str[1] == "A"pops[ends_with_a]Loading...
Heirarchical Columns!
df = titanic.groupby(["pclass", "sex"]).mean()df.loc[(2, "male")]survived 0.146199
age 30.815401
sibsp 0.327485
parch 0.192982
fare 19.904946
Name: (2, male), dtype: float64dfLoading...
df = titanic.groupby("sex").agg({
    "age": ["min", "max", "mean"],
    "fare": ["min", "max", "mean"],
    "survived": ["mean"]
})dfLoading...
df.indexIndex(['female', 'male'], dtype='object', name='sex')df.columnsMultiIndex([( 'age', 'min'),
( 'age', 'max'),
( 'age', 'mean'),
( 'fare', 'min'),
( 'fare', 'max'),
( 'fare', 'mean'),
('survived', 'mean')],
)df[("age", "mean")]sex
female 28.687071
male 30.585233
Name: (age, mean), dtype: float64df["age"]["mean"]sex
female 28.687071
male 30.585233
Name: mean, dtype: float64dfLoading...
Stack( ) and Unstack( )
popsLoading...
unstacked_df = pops.unstack(level="state")unstacked_df.stack().unstack()Loading...
titanic.groupby(["pclass", "sex"])["age"].mean()pclass sex
1 female 37.037594
male 41.029250
2 female 27.499191
male 30.815401
3 female 22.185307
male 25.962273
Name: age, dtype: float64titanic.groupby(["pclass", "sex"])["age"].mean().plot(kind="bar")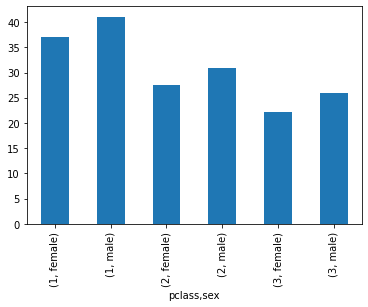
titanic.groupby(["pclass", "sex"])["age"].mean().unstack()Loading...
titanic.groupby(["pclass", "sex"])["age"].mean().unstack().plot(kind="bar")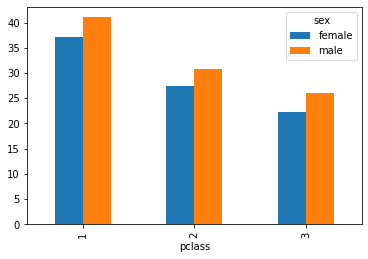
titanic.groupby(["pclass", "sex"])["age"].mean().unstack(level="pclass")Loading...
titanic.groupby(["pclass", "sex"])["age"].mean().unstack(level="pclass").plot(kind="bar")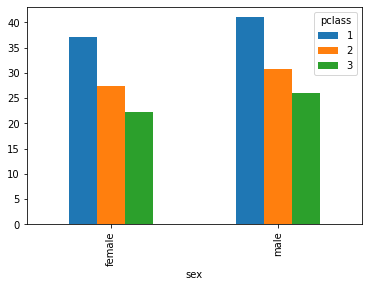
titanic.groupby(["sex", "survived"])["age"].mean()sex survived
female 0 25.255208
1 29.815354
male 0 31.516412
1 26.977778
Name: age, dtype: float64titanic.groupby(["sex", "survived"])["age"].mean().unstack()Loading...
titanic.groupby(["sex", "survived"])["age"].mean().unstack().plot(kind="bar")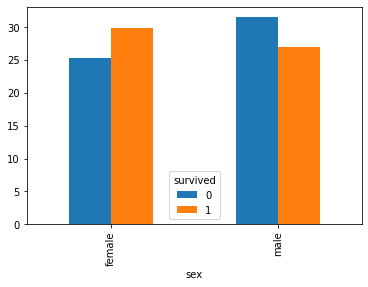
df = titanic.groupby(["sex", "survived"])["age"].mean()
df.unstack().rename(columns={0: "Died", 1: "Survived"}).plot(kind="bar")
pops.groupby(level=1).sum()Loading...
pops.groupby(level=0).min()Loading...
pops.groupby(level=[1,0]).min()Loading...
pops.indexMultiIndex([('AK', 1990),
('AK', 1991),
('AK', 1992),
('AK', 1993),
('AK', 1994),
('AK', 1995),
('AK', 1996),
('AK', 1997),
('AK', 1998),
('AK', 1999),
...
('WY', 2004),
('WY', 2005),
('WY', 2006),
('WY', 2007),
('WY', 2008),
('WY', 2009),
('WY', 2010),
('WY', 2011),
('WY', 2012),
('WY', 2013)],
names=['state', 'year'], length=1272)pops.groupby(["year", "state"]).min()Loading...